Plot
? |
Symb
? |
Source
* |
Average ? |
Thresholds ? |
N_
data |
QC1
parameter |
Data
downloads |
Remarks |
| method |
value |
unit |
method |
value |
| 1 |
• | QC1DB |
MEDIAN |
7886.95 |
ADU |
30% | ± 2366.09 |
53 |
qc_lam_flux_avg_1 |
this |
last_yr |
all
|
narrow band laser lamp 1 counts in higher flux flat |
| 2 |
• | QC1DB |
MEDIAN |
7824.6 |
ADU |
30% | ± 2347.38 |
52 |
qc_lam_flux_avg_1 |
this |
last_yr |
all
|
narrow band laser lamp 2 counts in higher flux flat |
| 3 |
• | QC1DB |
MEDIAN |
13485.9 |
ADU |
30% | ± 4045.77 |
51 |
qc_lam_flux_avg_1 |
this |
last_yr |
all
|
narrow band laser lamp 3 counts in higher flux flat |
| 4 |
• | QC1DB |
MEDIAN |
9484.84 |
ADU |
30% | ± 2845.45 |
54 |
qc_lam_flux_avg_1 |
this |
last_yr |
all
|
broad band halogen lamp counts in higher flux flat |
| |
|
*Data sources: QC1DB: QC1 database; LOCAL: local data source
|
| Plot 1 | | data source: | sphere_ifs_dflat
(QC1 database) |
| dataset: | qc_lam_flux_avg_1 | • |
| median: | 7886.95 | ADU |
| rel. thresholds: ±30% | 5520.865...10253.035 | ADU |
| N_data plotted: | 53 |
| [click plot for closeup] |
| Plot 2 | | data source: | sphere_ifs_dflat
(QC1 database) |
| dataset: | qc_lam_flux_avg_1 | • |
| median: | 7824.6 | ADU |
| rel. thresholds: ±30% | 5477.22...10171.98 | ADU |
| N_data plotted: | 52 |
| [click plot for closeup] |
| Plot 3 | | data source: | sphere_ifs_dflat
(QC1 database) |
| dataset: | qc_lam_flux_avg_1 | • |
| median: | 13485.9 | ADU |
| rel. thresholds: ±30% | 9440.13...17531.67 | ADU |
| N_data plotted: | 51 |
| [click plot for closeup] |
| Plot 4 | | data source: | sphere_ifs_dflat
(QC1 database) |
| dataset: | qc_lam_flux_avg_1 | • |
| median: | 9484.84 | ADU |
| rel. thresholds: ±30% | 6639.3915...12330.2985 | ADU |
| N_data plotted: | 54 |
| [click plot for closeup] |
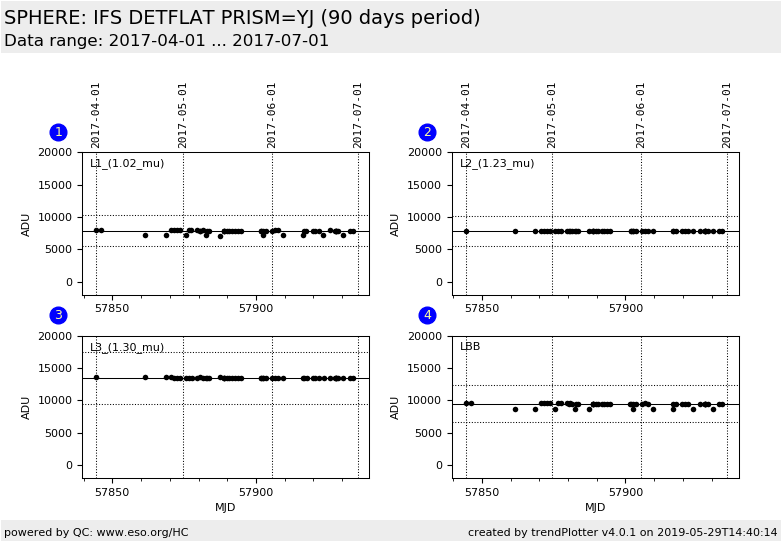
Imaging flats of the IFS arm.
2014-10-01: The template generates two raw frames, each one is a fits cube ( NAXIS = 3 ) with five layers
( NAXIS3 = 5 ) corresponding to NDIT=5 and with QC parameters:
QC.LAMP.FLUX.AVG.0 to
QC.LAMP.FLUX.AVG.4 (from the first raw frame cube) and QC parameters:
QC.LAMP.FLUX.AVG.5 to QC.LAMP.FLUX.AVG.9 (from the second raw frame
cube).
Here we plot qc_lam_flux_avg_1 (= QC.LAMP.FLUX.AVG.7 = middle layer of second cube).
LAMP_1 ... LAMP_4 are monochromatic LASER, LAMP_BB is a broad band halogen
lamp
Currently data from two different templates are shown with slightly different setups,
the 'Calibration Flats for Science' template and the 'Static Weekly Detector full calibration' template.
General information
Click on any of the plots to see a close-up version.
The latest date is indicated on top of the plot.
If configured,
- data points belonging to the latest date are specially marked
- statistical averages are indicated by a solid line, and thresholds by broken lines
- outliers are marked by a red asterisk. They are defined as data points outside the
threshold lines
- "aliens" (= data points outside the plot Y limits) are marked by a red arrow (↑ or ↓)
- you can download the data for each parameter set if the 'Data downloads' link shows up
|
