Plot
? |
Symb
? |
Source
* |
Average ? |
Thresholds ? |
N_
data |
QC1
parameter |
Data
downloads |
Remarks |
| method |
value |
unit |
method |
value |
| 1 |
o | QC1DB |
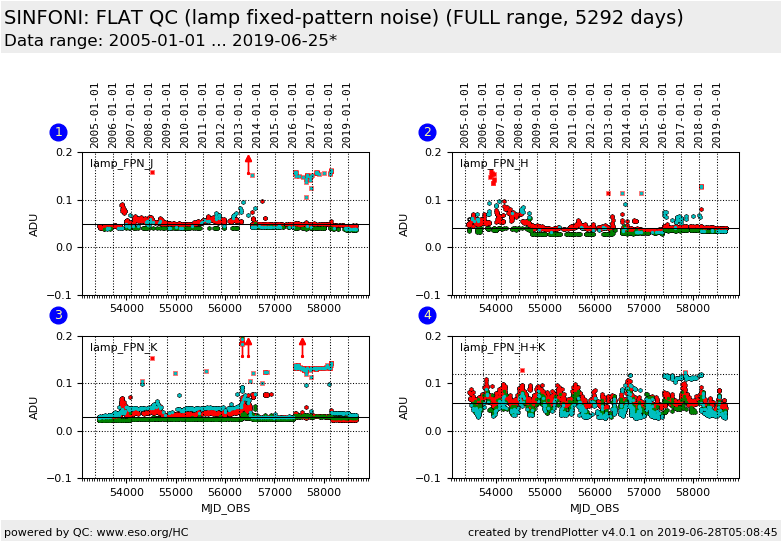
MEDIAN |
0.0482 |
ADU |
VAL | 0.00,0.10 |
1296 |
qc_lflat_fpn2 |
all (full time range)
| fixed pattern noise (region 2): J-band ALL camera scales |
| 1 |
• | QC1DB |
none |
|
ADU |
none | |
911 |
qc_lflat_fpn2 |
all (full time range)
| fixed pattern noise (region 2): J-band/250 mas scale |
| 1 |
• | QC1DB |
none |
|
ADU |
none | |
233 |
qc_lflat_fpn2 |
all (full time range)
| fixed pattern noise (region 2): J-band/100 mas scale |
| 1 |
• | QC1DB |
none |
|
ADU |
none | |
152 |
qc_lflat_fpn2 |
all (full time range)
| fixed pattern noise (region 2): J-band/ 25 mas scale |
|
| 2 |
o | QC1DB |
MEDIAN |
0.0396 |
ADU |
VAL | 0.00,0.10 |
1364 |
qc_lflat_fpn2 |
all (full time range)
| fixed pattern noise (region 2): H-band ALL camera scales |
| 2 |
• | QC1DB |
none |
|
ADU |
none | |
824 |
qc_lflat_fpn2 |
all (full time range)
| fixed pattern noise (region 2): H-band/250 mas scale |
| 2 |
• | QC1DB |
none |
|
ADU |
none | |
432 |
qc_lflat_fpn2 |
all (full time range)
| fixed pattern noise (region 2): H-band/100 mas scale |
| 2 |
• | QC1DB |
none |
|
ADU |
none | |
107 |
qc_lflat_fpn2 |
all (full time range)
| fixed pattern noise (region 2): H-band/ 25 mas scale |
|
| 3 |
o | QC1DB |
MEDIAN |
0.0293 |
ADU |
VAL | 0.00,0.10 |
2996 |
qc_lflat_fpn2 |
all (full time range)
| fixed pattern noise (region 2): K-band ALL camera scales |
| 3 |
• | QC1DB |
none |
|
ADU |
none | |
1270 |
qc_lflat_fpn2 |
all (full time range)
| fixed pattern noise (region 2): K-band at the 250 mas camera scale |
| 3 |
• | QC1DB |
none |
|
ADU |
none | |
1123 |
qc_lflat_fpn2 |
all (full time range)
| fixed pattern noise (region 2): K-band at the 100 mas camera scale |
| 3 |
• | QC1DB |
none |
|
ADU |
none | |
603 |
qc_lflat_fpn2 |
all (full time range)
| fixed pattern noise (region 2): K-band at the 25 mas camera scale |
|
| 4 |
o | QC1DB |
MEDIAN |
0.0573 |
ADU |
VAL | 0.00,0.12 |
2167 |
qc_lflat_fpn2 |
all (full time range)
| fixed pattern noise (region 2): H+K-band ALL camera scales |
| 4 |
• | QC1DB |
none |
|
ADU |
none | |
1042 |
qc_lflat_fpn2 |
all (full time range)
| fixed pattern noise (region 2): H+K-band at the 250 mas camera scale |
| 4 |
• | QC1DB |
none |
|
ADU |
none | |
537 |
qc_lflat_fpn2 |
all (full time range)
| fixed pattern noise (region 2): H+K-band at the 100 mas camera scale |
| 4 |
• | QC1DB |
none |
|
ADU |
none | |
588 |
qc_lflat_fpn2 |
all (full time range)
| fixed pattern noise (region 2): H+K-band at the 25 mas camera scale |
| |
|
*Data sources: QC1DB: QC1 database; LOCAL: local data source
|
