Plot
? |
Symb
? |
Source
* |
Average ? |
Thresholds ? |
N_
data |
QC1
parameter |
Data
downloads |
Remarks |
| method |
value |
unit |
method |
value |
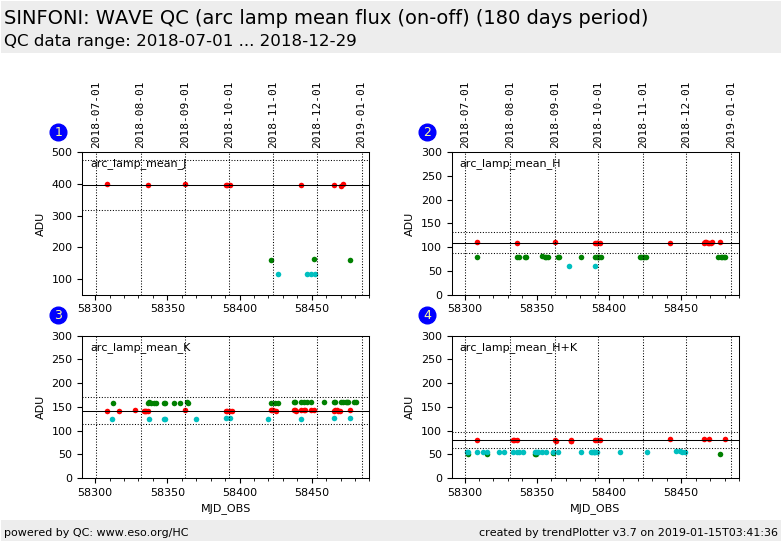
| 1 |
• | QC1DB |
MEDIAN |
397 |
ADU |
20% | ± 79.3 |
10 |
qc_frmdif_meanflux |
this |
last_yr |
all
|
arc lamp (on - off) mean flux: J-band/250 mas camera scale
(only this data set is scored) |
| 1 |
• | QC1DB |
none |
|
ADU |
none | |
3 |
qc_frmdif_meanflux |
this |
last_yr |
all
|
arc lamp (on - off) mean flux: J-band/100 mas scale |
| 1 |
• | QC1DB |
none |
|
ADU |
none | |
4 |
qc_frmdif_meanflux |
this |
last_yr |
all
|
arc lamp (on - off) mean flux: J-band/ 25 mas scale |
|
| 2 |
• | QC1DB |
MEDIAN |
109 |
ADU |
20% | ± 21.9 |
16 |
qc_frmdif_meanflux |
this |
last_yr |
all
|
arc lamp (on - off) mean flux: H-band/250 mas camera scale
(only this data set is scored) |
| 2 |
• | QC1DB |
none |
|
ADU |
none | |
27 |
qc_frmdif_meanflux |
this |
last_yr |
all
|
arc lamp (on - off) mean flux: H-band/100 mas scale |
| 2 |
• | QC1DB |
none |
|
ADU |
none | |
2 |
qc_frmdif_meanflux |
this |
last_yr |
all
|
arc lamp (on - off) mean flux: H-band 25 mas scale |
|
| 3 |
• | QC1DB |
MEDIAN |
142 |
ADU |
20% | ± 28.5 |
30 |
qc_frmdif_meanflux |
this |
last_yr |
all
|
arc lamp (on - off) mean flux: K-band/250 mas camera scale
(only this data set is scored) |
| 3 |
• | QC1DB |
none |
|
ADU |
none | |
31 |
qc_frmdif_meanflux |
this |
last_yr |
all
|
arc lamp (on - off) mean flux: K-band/100 mas scale |
| 3 |
• | QC1DB |
none |
|
ADU |
none | |
11 |
qc_frmdif_meanflux |
this |
last_yr |
all
|
arc lamp (on - off) mean flux: K-band/ 25 mas scale |
|
| 4 |
• | QC1DB |
MEDIAN |
80.5 |
ADU |
20% | ± 16.1 |
16 |
qc_frmdif_meanflux |
this |
last_yr |
all
|
arc lamp (on - off) mean flux: H+K-band/250 mas camera scale
(only this data set is scored) |
| 4 |
• | QC1DB |
none |
|
ADU |
none | |
6 |
qc_frmdif_meanflux |
this |
last_yr |
all
|
arc lamp (on - off) mean flux: H+K-band/100 mas scale |
| 4 |
• | QC1DB |
none |
|
ADU |
none | |
32 |
qc_frmdif_meanflux |
this |
last_yr |
all
|
arc lamp (on - off) mean flux: H+K-band/ 25 mas scale |
| |
|
*Data sources: QC1DB: QC1 database; LOCAL: local data source
|
