|
|
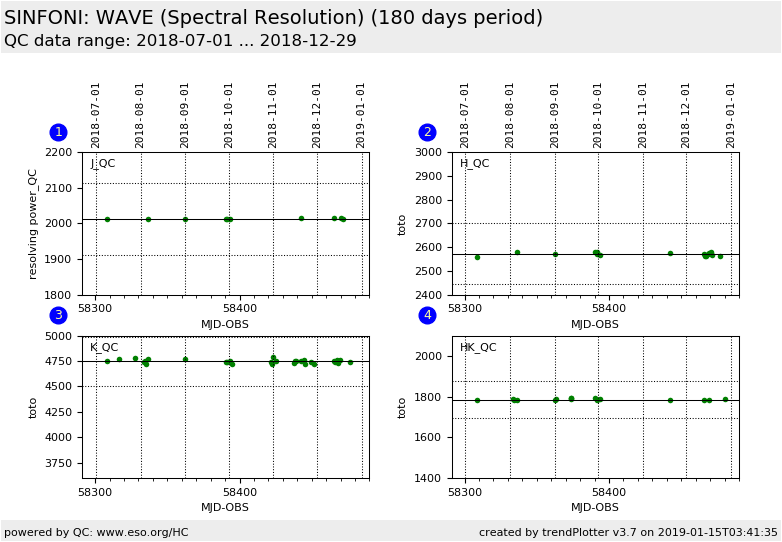
| SINFONI trending system: HISTORY report |
|
|
|
Last update: 2019-01-15T03:41:40 (UT)
|
|
|
|
|
*Date on this monitor changes at 21:00 UT |
|

|
|
|
Plot
? |
Symb
? |
Source
* |
Average ? |
Thresholds ? |
N_
data |
QC1
parameter |
Data
downloads |
Remarks |
| method |
value |
unit |
method |
value |
| 1 |
• | QC1DB |
MEDIAN |
2.01e+03 |
unitless |
5% | ± 101 |
10 |
qc_spec_res_med |
this |
last_yr |
all
|
median resolving power from arc lamp spectral lines (QC script) in the J-band (250 mas camera scale) |
| 2 |
• | QC1DB |
MEDIAN |
2.57e+03 |
unitless |
5% | ± 129 |
16 |
qc_spec_res_med |
this |
last_yr |
all
|
median resolving power from arc lamp spectral lines (QC script) in the H-band (250 mas camera scale) |
| 3 |
• | QC1DB |
MEDIAN |
4.75e+03 |
unitless |
5% | ± 237 |
30 |
qc_spec_res_med |
this |
last_yr |
all
|
median resolving power from arc lamp spectral lines (QC script) in the K-band (250 mas camera scale) |
| 4 |
• | QC1DB |
MEDIAN |
1.79e+03 |
unitless |
5% | ± 89.3 |
16 |
qc_spec_res_med |
this |
last_yr |
all
|
median resolving power from arc lamp spectral lines (QC script) in the H+K-band (250 mas camera scale) |
| |
|
*Data sources: QC1DB: QC1 database; LOCAL: local data source
|
| Plot 1 | | data source: | sinfoni_wave
(QC1 database) |
| dataset: | qc_spec_res_med | • |
| median: | 2.01e+03 | unitless |
| rel. thresholds: ±5% | 1912.56889045...2113.89193155 | unitless |
| N_data plotted: | 10 |
| [click plot for closeup] |
| Plot 2 | | data source: | sinfoni_wave
(QC1 database) |
| dataset: | qc_spec_res_med | • |
| median: | 2.57e+03 | unitless |
| rel. thresholds: ±5% | 2444.00694692...2701.27083607 | unitless |
| N_data plotted: | 16 |
| [click plot for closeup] |
| Plot 3 | | data source: | sinfoni_wave
(QC1 database) |
| dataset: | qc_spec_res_med | • |
| median: | 4.75e+03 | unitless |
| rel. thresholds: ±5% | 4509.4501827...4984.1291493 | unitless |
| N_data plotted: | 30 |
| [click plot for closeup] |
| Plot 4 | | data source: | sinfoni_wave
(QC1 database) |
| dataset: | qc_spec_res_med | • |
| median: | 1.79e+03 | unitless |
| rel. thresholds: ±5% | 1696.57891918...1875.16617382 | unitless |
| N_data plotted: | 16 |
| [click plot for closeup] |
green dots: the resolution is calculated using the QC script
General information
Click on any of the plots to see a close-up version.
The latest date is indicated on top of the plot.
If configured,
- data points belonging to the latest date are specially marked
- statistical averages are indicated by a solid line, and thresholds by broken lines
- outliers are marked by a red asterisk. They are defined as data points outside the
threshold lines
- "aliens" (= data points outside the plot Y limits) are marked by a red arrow (↑ or ↓)
- you can download the data for each parameter set if the 'Data downloads' link shows up
|