|
|
| SINFONI trending system: HISTORY report |
|
|
|
Last update: 2015-07-15T03:31:39 (UT)
|
|
|
|
|
*Date on this monitor changes at 21:00 UT |
|

|
|
|
Plot
? |
Symb
? |
Source
* |
Average ? |
Thresholds ? |
N_
data |
QC1
parameter |
Data
downloads |
Remarks |
| method |
value |
unit |
method |
value |
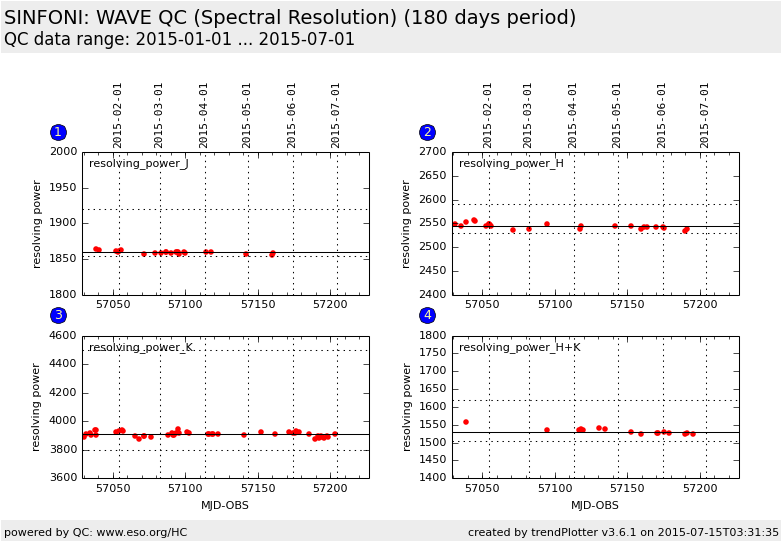
| 1 |
• | QC1DB |
MEDIAN |
1.86e+03 |
unitless |
VAL | 1855.,1920. |
23 |
qc_coef1_med |
this |
last_yr |
all
|
median resolving power from arc lamp spectral lines in the J-band (250 mas camera scale) |
| 2 |
• | QC1DB |
MEDIAN |
2.54e+03 |
unitless |
VAL | 2530.,2590. |
29 |
qc_coef1_med |
this |
last_yr |
all
|
median resolving power from arc lamp spectral lines in the H-band (250 mas camera scale) |
| 3 |
• | QC1DB |
MEDIAN |
3.91e+03 |
unitless |
VAL | 3800.,4495. |
52 |
qc_coef1_med |
this |
last_yr |
all
|
median resolving power from arc lamp spectral lines in the K-band (250 mas camera scale) |
| 4 |
• | QC1DB |
MEDIAN |
1.53e+03 |
unitless |
VAL | 1505.,1620. |
17 |
qc_coef1_med |
this |
last_yr |
all
|
median resolving power from arc lamp spectral lines in the H+K-band (250 mas camera scale) |
| |
|
*Data sources: QC1DB: QC1 database; LOCAL: local data source
|
| Plot 1 | | data source: | sinfoni_wave
(QC1 database) |
| dataset: | qc_coef1_med | • |
| median: | 1.86e+03 | unitless |
| fixed thresholds: | 1855.0...1920.0 | unitless |
| N_data plotted: | 23 |
| [click on plot for closeup] |
| Plot 2 | | data source: | sinfoni_wave
(QC1 database) |
| dataset: | qc_coef1_med | • |
| median: | 2.54e+03 | unitless |
| fixed thresholds: | 2530.0...2590.0 | unitless |
| N_data plotted: | 29 |
| [click on plot for closeup] |
| Plot 3 | | data source: | sinfoni_wave
(QC1 database) |
| dataset: | qc_coef1_med | • |
| median: | 3.91e+03 | unitless |
| fixed thresholds: | 3800.0...4495.0 | unitless |
| N_data plotted: | 52 |
| [click on plot for closeup] |
| Plot 4 | | data source: | sinfoni_wave
(QC1 database) |
| dataset: | qc_coef1_med | • |
| median: | 1.53e+03 | unitless |
| fixed thresholds: | 1505.0...1620.0 | unitless |
| N_data plotted: | 17 |
| [click on plot for closeup] |
green dots: the resolution is calculated using the QC script
General information
Click on any of the plots to see a close-up version.
The latest date is indicated on top of the plot.
If configured,
- data points belonging to the latest date are specially marked
- statistical averages are indicated by a solid line, and thresholds by broken lines
- outliers are marked by a red asterisk. They are defined as data points outside the
threshold lines
- "aliens" (= data points outside the plot Y limits) are marked by a red arrow (↑ or ↓)
- you can download the data for each parameter set if the 'Data downloads' link shows up
|