Plot
? |
Symb
? |
Source
* |
Average ? |
Thresholds ? |
N_
data |
QC1
parameter |
Data
downloads |
Remarks |
| method |
value |
unit |
method |
value |
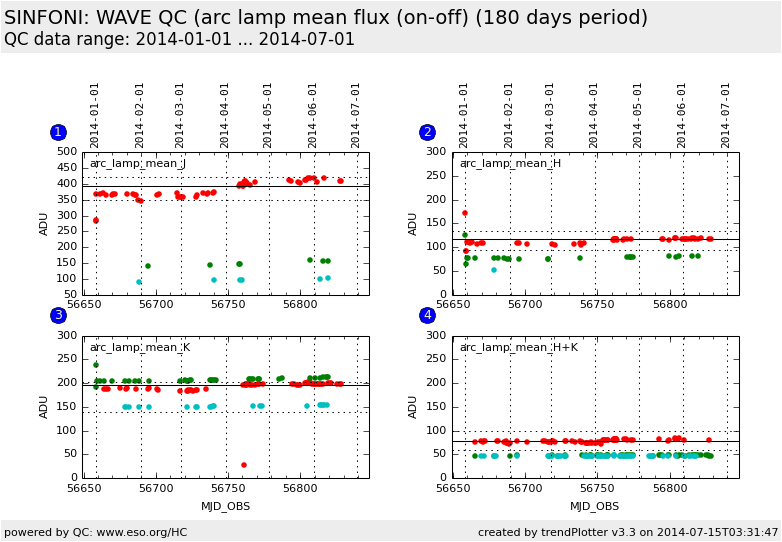
| 1 |
• | QC1DB |
MEDIAN |
394 |
ADU |
VAL | 350.0,420.0 |
63 |
qc_frmdif_meanflux |
this |
last_yr |
all
|
arc lamp (on - off) mean flux: J-band/250 mas camera scale
(only this data set is scored) |
| 1 |
• | QC1DB |
none |
|
ADU |
none | |
7 |
qc_frmdif_meanflux |
this |
last_yr |
all
|
arc lamp (on - off) mean flux: J-band/100 mas scale |
| 1 |
• | QC1DB |
none |
|
ADU |
none | |
6 |
qc_frmdif_meanflux |
this |
last_yr |
all
|
arc lamp (on - off) mean flux: J-band/ 25 mas scale |
|
| 2 |
• | QC1DB |
MEDIAN |
116 |
ADU |
VAL | 95.0,135.0 |
53 |
qc_frmdif_meanflux |
this |
last_yr |
all
|
arc lamp (on - off) mean flux: H-band/250 mas camera scale
(only this data set is scored) |
| 2 |
• | QC1DB |
none |
|
ADU |
none | |
24 |
qc_frmdif_meanflux |
this |
last_yr |
all
|
arc lamp (on - off) mean flux: H-band/100 mas scale |
| 2 |
• | QC1DB |
none |
|
ADU |
none | |
1 |
qc_frmdif_meanflux |
this |
last_yr |
all
|
arc lamp (on - off) mean flux: H-band 25 mas scale |
|
| 3 |
• | QC1DB |
MEDIAN |
197 |
ADU |
VAL | 140.0,202.0 |
60 |
qc_frmdif_meanflux |
this |
last_yr |
all
|
arc lamp (on - off) mean flux: K-band/250 mas camera scale
(only this data set is scored) |
| 3 |
• | QC1DB |
none |
|
ADU |
none | |
39 |
qc_frmdif_meanflux |
this |
last_yr |
all
|
arc lamp (on - off) mean flux: K-band/100 mas scale |
| 3 |
• | QC1DB |
none |
|
ADU |
none | |
21 |
qc_frmdif_meanflux |
this |
last_yr |
all
|
arc lamp (on - off) mean flux: K-band/ 25 mas scale |
|
| 4 |
• | QC1DB |
MEDIAN |
78.1 |
ADU |
VAL | 60.0,100.0 |
73 |
qc_frmdif_meanflux |
this |
last_yr |
all
|
arc lamp (on - off) mean flux: H+K-band/250 mas camera scale
(only this data set is scored) |
| 4 |
• | QC1DB |
none |
|
ADU |
none | |
52 |
qc_frmdif_meanflux |
this |
last_yr |
all
|
arc lamp (on - off) mean flux: H+K-band/100 mas scale |
| 4 |
• | QC1DB |
none |
|
ADU |
none | |
58 |
qc_frmdif_meanflux |
this |
last_yr |
all
|
arc lamp (on - off) mean flux: H+K-band/ 25 mas scale |
| |
|
*Data sources: QC1DB: QC1 database; LOCAL: local text file
|
