Plot
? |
Symb
? |
Source
* |
Average ? |
Thresholds ? |
N_
data |
QC1
parameter |
Data
downloads |
Remarks |
| method |
value |
unit |
method |
value |
| 1 |
• | QC1DB |
MEDIAN |
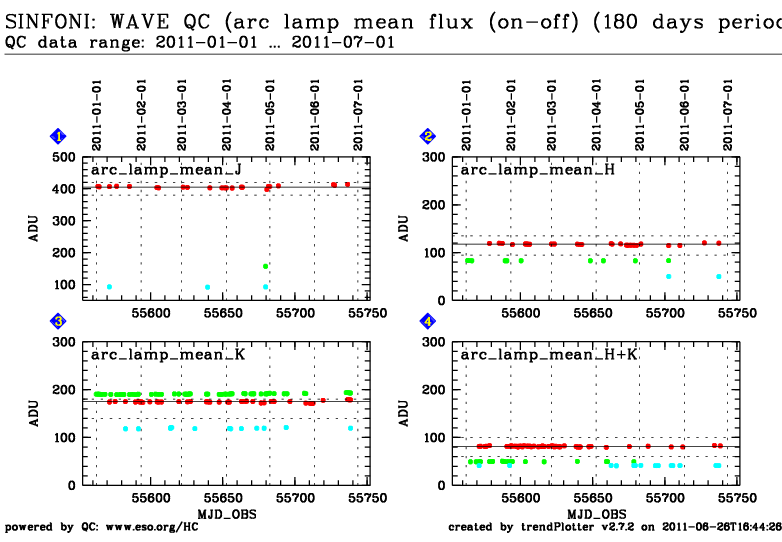
405.40302 |
ADU |
VAL | 380.0,420.0 |
23 |
qc_frmdif_meanflux |
this |
last_yr |
all
|
arc lamp (on - off) mean flux: J-band/250 mas camera scale
(only this data set is scored) |
| 1 |
• | QC1DB |
none |
|
ADU |
none | |
1 |
qc_frmdif_meanflux |
this |
last_yr |
all
|
arc lamp (on - off) mean flux: J-band/100 mas scale |
| 1 |
• | QC1DB |
none |
|
ADU |
none | |
3 |
qc_frmdif_meanflux |
this |
last_yr |
all
|
arc lamp (on - off) mean flux: J-band/ 25 mas scale |
|
| 2 |
• | QC1DB |
MEDIAN |
117.713 |
ADU |
VAL | 95.0,135.0 |
26 |
qc_frmdif_meanflux |
this |
last_yr |
all
|
arc lamp (on - off) mean flux: H-band/250 mas camera scale
(only this data set is scored) |
| 2 |
• | QC1DB |
none |
|
ADU |
none | |
10 |
qc_frmdif_meanflux |
this |
last_yr |
all
|
arc lamp (on - off) mean flux: H-band/100 mas scale |
| 2 |
• | QC1DB |
none |
|
ADU |
none | |
2 |
qc_frmdif_meanflux |
this |
last_yr |
all
|
arc lamp (on - off) mean flux: H-band 25 mas scale |
|
| 3 |
• | QC1DB |
MEDIAN |
174.62199 |
ADU |
VAL | 140.0,180.0 |
39 |
qc_frmdif_meanflux |
this |
last_yr |
all
|
arc lamp (on - off) mean flux: K-band/250 mas camera scale
(only this data set is scored) |
| 3 |
• | QC1DB |
none |
|
ADU |
none | |
56 |
qc_frmdif_meanflux |
this |
last_yr |
all
|
arc lamp (on - off) mean flux: K-band/100 mas scale |
| 3 |
• | QC1DB |
none |
|
ADU |
none | |
13 |
qc_frmdif_meanflux |
this |
last_yr |
all
|
arc lamp (on - off) mean flux: K-band/ 25 mas scale |
|
| 4 |
• | QC1DB |
MEDIAN |
81.5077 |
ADU |
VAL | 60.0,100.0 |
46 |
qc_frmdif_meanflux |
this |
last_yr |
all
|
arc lamp (on - off) mean flux: H+K-band/250 mas camera scale
(only this data set is scored) |
| 4 |
• | QC1DB |
none |
|
ADU |
none | |
19 |
qc_frmdif_meanflux |
this |
last_yr |
all
|
arc lamp (on - off) mean flux: H+K-band/100 mas scale |
| 4 |
• | QC1DB |
none |
|
ADU |
none | |
14 |
qc_frmdif_meanflux |
this |
last_yr |
all
|
arc lamp (on - off) mean flux: H+K-band/ 25 mas scale |
| |
|
*Data sources: QC1DB: QC1 database; LOCAL: local text file
|


