|
|
| PIONIER trending system: HISTORY report |
|
|
|
Last update: 2018-06-20T13:33:11 (UT)
|
|
|
|
|
*Date on this monitor changes at 21:00 UT |
|

|
|
|
Plot
? |
Symb
? |
Source
* |
Average ? |
Thresholds ? |
N_
data |
QC1
parameter |
Data
downloads |
Remarks |
| method |
value |
unit |
method |
value |
| 1 |
• | QC1DB |
none |
|
NONE |
none | |
1379 |
trans1 |
this |
last_yr |
all
|
transmission AT1-GRISM-High Sensitivity station1 |
| 1 |
• | QC1DB |
none |
|
NONE |
none | |
0 |
trans2 |
this |
last_yr |
all
|
station2 |
| 1 |
• | QC1DB |
none |
|
NONE |
none | |
0 |
trans3 |
this |
last_yr |
all
|
station3 |
| 1 |
• | QC1DB |
none |
|
NONE |
none | |
0 |
trans4 |
this |
last_yr |
all
|
station4 |
|
| 2 |
• | QC1DB |
none |
|
NONE |
none | |
0 |
trans1 |
this |
last_yr |
all
|
transmission AT2-GRISM-High Sensitivity station1 |
| 2 |
• | QC1DB |
none |
|
NONE |
none | |
1379 |
trans2 |
this |
last_yr |
all
|
station2 |
| 2 |
• | QC1DB |
none |
|
NONE |
none | |
0 |
trans3 |
this |
last_yr |
all
|
station3 |
| 2 |
• | QC1DB |
none |
|
NONE |
none | |
0 |
trans4 |
this |
last_yr |
all
|
station4 |
|
| 3 |
• | QC1DB |
none |
|
NONE |
none | |
0 |
trans1 |
this |
last_yr |
all
|
transmission AT3-GRISM-High Sensitivity station1 |
| 3 |
• | QC1DB |
none |
|
NONE |
none | |
0 |
trans2 |
this |
last_yr |
all
|
station2 |
| 3 |
• | QC1DB |
none |
|
NONE |
none | |
1379 |
trans3 |
this |
last_yr |
all
|
station3 |
| 3 |
• | QC1DB |
none |
|
NONE |
none | |
0 |
trans4 |
this |
last_yr |
all
|
station4 |
|
| 4 |
• | QC1DB |
none |
|
NONE |
none | |
0 |
trans1 |
this |
last_yr |
all
|
transmission AT4-GRISM-High Sensitivity station1 |
| 4 |
• | QC1DB |
none |
|
NONE |
none | |
0 |
trans2 |
this |
last_yr |
all
|
station2 |
| 4 |
• | QC1DB |
none |
|
NONE |
none | |
0 |
trans3 |
this |
last_yr |
all
|
station3 |
| 4 |
• | QC1DB |
none |
|
NONE |
none | |
1379 |
trans4 |
this |
last_yr |
all
|
station4 |
|
| 5 |
• | QC1DB |
none |
|
NONE |
none | |
10 |
trans1 |
this |
last_yr |
all
|
transmission AT1-FREE-High Sensitivity station1 |
| 5 |
• | QC1DB |
none |
|
NONE |
none | |
0 |
trans2 |
this |
last_yr |
all
|
station2 |
| 5 |
• | QC1DB |
none |
|
NONE |
none | |
0 |
trans3 |
this |
last_yr |
all
|
station3 |
| 5 |
• | QC1DB |
none |
|
NONE |
none | |
0 |
trans4 |
this |
last_yr |
all
|
station4 |
|
| 6 |
• | QC1DB |
none |
|
NONE |
none | |
0 |
trans1 |
this |
last_yr |
all
|
transmission AT2-FREE-High Sensitivity station1 |
| 6 |
• | QC1DB |
none |
|
NONE |
none | |
10 |
trans2 |
this |
last_yr |
all
|
station2 |
| 6 |
• | QC1DB |
none |
|
NONE |
none | |
0 |
trans3 |
this |
last_yr |
all
|
station3 |
| 6 |
• | QC1DB |
none |
|
NONE |
none | |
0 |
trans4 |
this |
last_yr |
all
|
station4 |
|
| 7 |
• | QC1DB |
none |
|
NONE |
none | |
0 |
trans1 |
this |
last_yr |
all
|
transmission AT3-FREE-High Sensitivity station1 |
| 7 |
• | QC1DB |
none |
|
NONE |
none | |
0 |
trans2 |
this |
last_yr |
all
|
station2 |
| 7 |
• | QC1DB |
none |
|
NONE |
none | |
10 |
trans3 |
this |
last_yr |
all
|
station3 |
| 7 |
• | QC1DB |
none |
|
NONE |
none | |
0 |
trans4 |
this |
last_yr |
all
|
station4 |
|
| 8 |
• | QC1DB |
none |
|
NONE |
none | |
0 |
trans1 |
this |
last_yr |
all
|
transmission AT4-FREE-High Sensitivity station1 |
| 8 |
• | QC1DB |
none |
|
NONE |
none | |
0 |
trans2 |
this |
last_yr |
all
|
station2 |
| 8 |
• | QC1DB |
none |
|
NONE |
none | |
0 |
trans3 |
this |
last_yr |
all
|
station3 |
| 8 |
• | QC1DB |
none |
|
NONE |
none | |
10 |
trans4 |
this |
last_yr |
all
|
station4 |
|
| |
|
*Data sources: QC1DB: QC1 database; LOCAL: local data source
|
| Plot 1 | | data source: | pionier_fringe_tech
(QC1 database) |
dataset:
(numbers below apply to this dataset) | trans1 | • |
| average: | none |
| thresholds: | none |
| N_data plotted: | 1379 |
| [click plot for closeup] |
| Plot 2 | | data source: | pionier_fringe_tech
(QC1 database) |
dataset:
(numbers below apply to this dataset) | trans1 | • |
| average: | none |
| thresholds: | none |
| N_data plotted: | 0 |
| [click plot for closeup] |
| Plot 3 | | data source: | pionier_fringe_tech
(QC1 database) |
dataset:
(numbers below apply to this dataset) | trans1 | • |
| average: | none |
| thresholds: | none |
| N_data plotted: | 0 |
| [click plot for closeup] |
| Plot 4 | | data source: | pionier_fringe_tech
(QC1 database) |
dataset:
(numbers below apply to this dataset) | trans1 | • |
| average: | none |
| thresholds: | none |
| N_data plotted: | 0 |
| [click plot for closeup] |
| Plot 5 | | data source: | pionier_fringe_tech
(QC1 database) |
dataset:
(numbers below apply to this dataset) | trans1 | • |
| average: | none |
| thresholds: | none |
| N_data plotted: | 10 |
| [click plot for closeup] |
| Plot 6 | | data source: | pionier_fringe_tech
(QC1 database) |
dataset:
(numbers below apply to this dataset) | trans1 | • |
| average: | none |
| thresholds: | none |
| N_data plotted: | 0 |
| [click plot for closeup] |
| Plot 7 | | data source: | pionier_fringe_tech
(QC1 database) |
dataset:
(numbers below apply to this dataset) | trans1 | • |
| average: | none |
| thresholds: | none |
| N_data plotted: | 0 |
| [click plot for closeup] |
| Plot 8 | | data source: | pionier_fringe_tech
(QC1 database) |
dataset:
(numbers below apply to this dataset) | trans1 | • |
| average: | none |
| thresholds: | none |
| N_data plotted: | 0 |
| [click plot for closeup] |
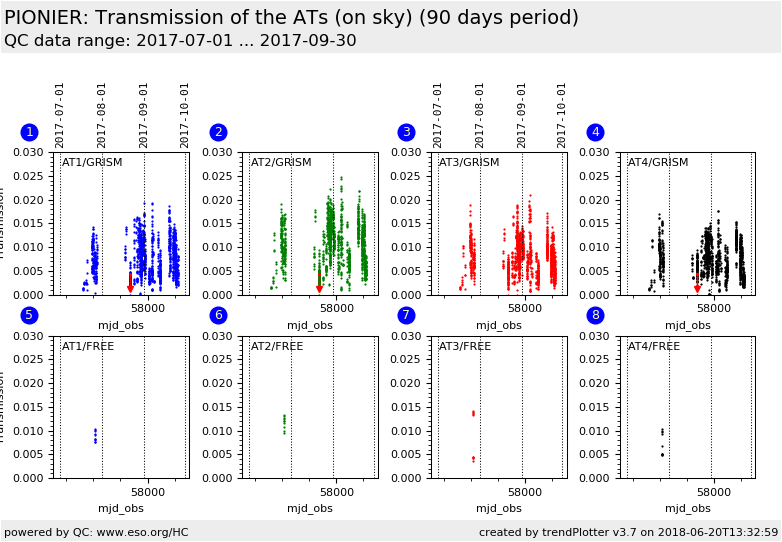
Transmission measured on the astronomical calibrators (sky) for the different settings
This is calculated when the H magnitude is available on the calibrator.
All the data are used even when taken in bad atmospheric
conditions.
The UT plot shows the transmission of the UTs
The AT plot shows the transmission of the ATs
For the ATs the colors in the individual plots correspond to the station where
the AT is positionned:
- blue : ATi on Station1
- green: ATi on Sation2
- red: ATi on Station3
- black: ATi on Station4
The throughput of PIONIER is also monitored using an internal lamp (see Daily
Calibrations)
General information
Click on any of the plots to see a close-up version.
The latest date is indicated on top of the plot.
If configured,
- data points belonging to the latest date are specially marked
- statistical averages are indicated by a solid line, and thresholds by broken lines
- outliers are marked by a red asterisk. They are defined as data points outside the
threshold lines
- "aliens" (= data points outside the plot Y limits) are marked by a red arrow (↑ or ↓)
- you can download the data for each parameter set if the 'Data downloads' link shows up
|