Plot
? |
Symb
? |
Source
* |
Average ? |
Thresholds ? |
N_
data |
QC1
parameter |
Data
downloads |
Remarks |
| method |
value |
unit |
method |
value |
| 1 |
• | QC1DB |
MEDIAN |
4.25e+03 |
ADU |
VAL | 3000,5800 |
2 |
flat_med_max |
this |
last_yr |
all
|
median lamp flat counts for J, S27, Double_RdRstRd |
| 2 |
• | QC1DB |
MEDIAN |
5.02e+03 |
ADU |
VAL | 3000,5800 |
2 |
flat_med_max |
this |
last_yr |
all
|
median lamp flat counts for H, S27, Double_RdRstRd |
| 3 |
• | QC1DB |
MEDIAN |
4.43e+03 |
ADU |
VAL | 3000,5800 |
3 |
flat_med_max |
this |
last_yr |
all
|
median lamp flat counts for Ks, S27, Double_RdRstRd |
| 4 |
• | QC1DB |
MEDIAN |
3.6e+03 |
ADU |
VAL | 2800,5800 |
1 |
flat_med_max |
this |
last_yr |
all
|
median lamp flat counts for J, S27, FowlerNsamp |
| 5 |
• | QC1DB |
MEDIAN |
3.96e+03 |
ADU |
VAL | 3000,5800 |
1 |
flat_med_max |
this |
last_yr |
all
|
median lamp flat counts for H, S27, FowlerNsamp |
| 6 |
• | QC1DB |
MEDIAN |
3.67e+03 |
ADU |
VAL | 3000,5800 |
8 |
flat_med_max |
this |
last_yr |
all
|
median lamp flat counts for Ks, S27, FowlerNsamp |
| |
|
*Data sources: QC1DB: QC1 database; LOCAL: local data source
|
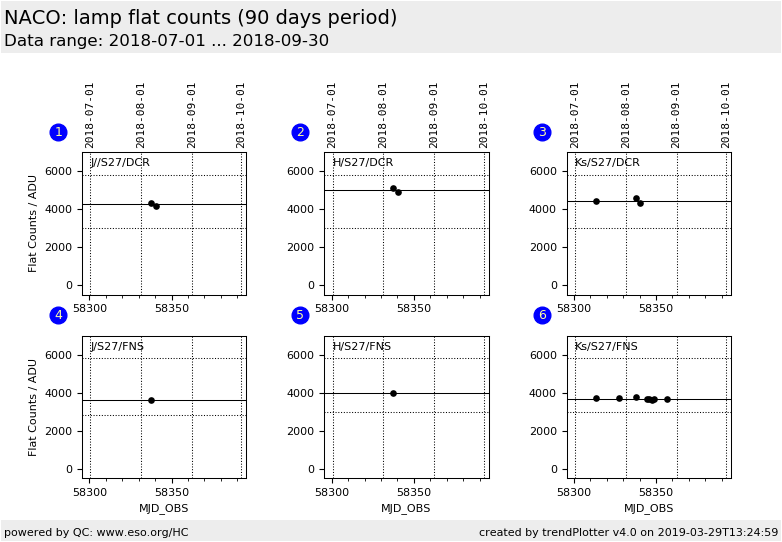
| Plot 1 | | data source: | naco_lampflat
(QC1 database) |
| dataset: | flat_med_max | • |
| median: | 4.25e+03 | ADU |
| fixed thresholds: | 3000...5800 | ADU |
| N_data plotted: | 2 |
| [click plot for closeup] |
| Plot 2 | | data source: | naco_lampflat
(QC1 database) |
| dataset: | flat_med_max | • |
| median: | 5.02e+03 | ADU |
| fixed thresholds: | 3000...5800 | ADU |
| N_data plotted: | 2 |
| [click plot for closeup] |
| Plot 3 | | data source: | naco_lampflat
(QC1 database) |
| dataset: | flat_med_max | • |
| median: | 4.43e+03 | ADU |
| fixed thresholds: | 3000...5800 | ADU |
| N_data plotted: | 3 |
| [click plot for closeup] |
| Plot 4 | | data source: | naco_lampflat
(QC1 database) |
| dataset: | flat_med_max | • |
| median: | 3.6e+03 | ADU |
| fixed thresholds: | 2800...5800 | ADU |
| N_data plotted: | 1 |
| [click plot for closeup] |
| Plot 5 | | data source: | naco_lampflat
(QC1 database) |
| dataset: | flat_med_max | • |
| median: | 3.96e+03 | ADU |
| fixed thresholds: | 3000...5800 | ADU |
| N_data plotted: | 1 |
| [click plot for closeup] |
| Plot 6 | | data source: | naco_lampflat
(QC1 database) |
| dataset: | flat_med_max | • |
| median: | 3.67e+03 | ADU |
| fixed thresholds: | 3000...5800 | ADU |
| N_data plotted: | 8 |
| [click plot for closeup] |
Median value of the maximum counts of the LAMP-ON raw frames taken
with the S27 camera. The data points are separated for different broad
band filters.
General information
Click on any of the plots to see a close-up version.
The latest date is indicated on top of the plot.
If configured,
- data points belonging to the latest date are specially marked
- statistical averages are indicated by a solid line, and thresholds by broken lines
- outliers are marked by a red asterisk. They are defined as data points outside the
threshold lines
- "aliens" (= data points outside the plot Y limits) are marked by a red arrow (↑ or ↓)
- you can download the data for each parameter set if the 'Data downloads' link shows up
|
