Plot
? |
Symb
? |
Source
* |
Average ? |
Thresholds ? |
N_
data |
QC1
parameter |
Data
downloads |
Remarks |
| method |
value |
unit |
method |
value |
| 1 |
• | QC1DB |
none |
|
ADU |
none | |
7 |
lamp_flux |
this |
last_yr |
all
|
median lamp flat counts for J, S13, Double_RdRstRd |
| 2 |
• | QC1DB |
none |
|
ADU |
none | |
13 |
lamp_flux |
this |
last_yr |
all
|
median lamp flat counts for H, S13, Double_RdRstRd |
| 3 |
• | QC1DB |
none |
|
ADU |
none | |
18 |
lamp_flux |
this |
last_yr |
all
|
median lamp flat counts for Ks, S13, Double_RdRstRd |
| 4 |
• | QC1DB |
none |
|
ADU |
none | |
3 |
lamp_flux |
this |
last_yr |
all
|
median lamp flat counts for J, S13, FowlerNsamp |
| 5 |
• | QC1DB |
none |
|
ADU |
none | |
0 |
lamp_flux |
this |
last_yr |
all
|
median lamp flat counts for H, S13, FowlerNsamp |
| 6 |
• | QC1DB |
none |
|
ADU |
none | |
0 |
lamp_flux |
this |
last_yr |
all
|
median lamp flat counts for Ks, S13, FowlerNsamp |
| |
|
*Data sources: QC1DB: QC1 database; LOCAL: local data source
|
| Plot 1 | | data source: | naco_lampflat
(QC1 database) |
| dataset: | lamp_flux | • |
| average: | none |
| thresholds: | none |
| N_data plotted: | 7 |
| [click plot for closeup] |
| Plot 2 | | data source: | naco_lampflat
(QC1 database) |
| dataset: | lamp_flux | • |
| average: | none |
| thresholds: | none |
| N_data plotted: | 13 |
| [click plot for closeup] |
| Plot 3 | | data source: | naco_lampflat
(QC1 database) |
| dataset: | lamp_flux | • |
| average: | none |
| thresholds: | none |
| N_data plotted: | 18 |
| [click plot for closeup] |
| Plot 4 | | data source: | naco_lampflat
(QC1 database) |
| dataset: | lamp_flux | • |
| average: | none |
| thresholds: | none |
| N_data plotted: | 3 |
| [click plot for closeup] |
| Plot 5 | | data source: | naco_lampflat
(QC1 database) |
| dataset: | lamp_flux | • |
| average: | none |
| thresholds: | none |
| N_data plotted: | 0 |
| [click plot for closeup] |
| Plot 6 | | data source: | naco_lampflat
(QC1 database) |
| dataset: | lamp_flux | • |
| average: | none |
| thresholds: | none |
| N_data plotted: | 0 |
| [click plot for closeup] |
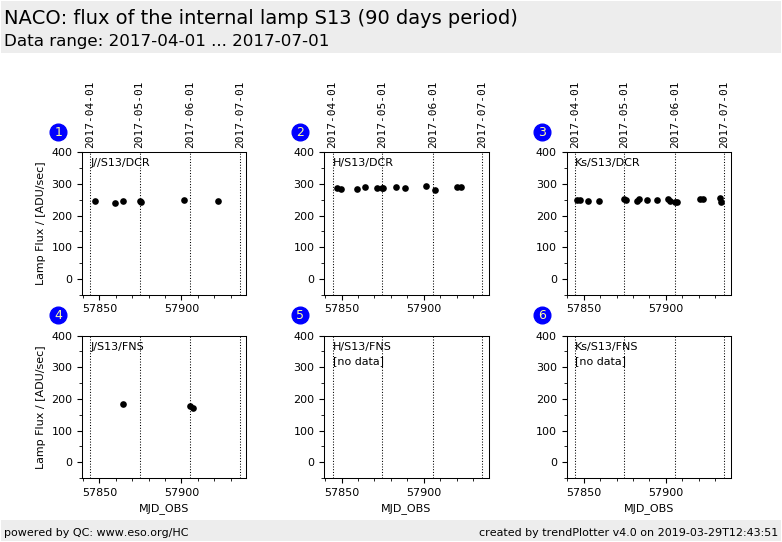
This plots shows the lamp flux in ADU/sec derived from lamp flat fields.
The plot is divided in three broad band filters to monitor beside
the lamp property also the throughput per filter.
General information
Click on any of the plots to see a close-up version.
The latest date is indicated on top of the plot.
If configured,
- data points belonging to the latest date are specially marked
- statistical averages are indicated by a solid line, and thresholds by broken lines
- outliers are marked by a red asterisk. They are defined as data points outside the
threshold lines
- "aliens" (= data points outside the plot Y limits) are marked by a red arrow (↑ or ↓)
- you can download the data for each parameter set if the 'Data downloads' link shows up
|
