|
[page auto-refreshes after 60 sec]
[press Ctrl+R to enforce refresh of scores and dates]
| NACO trending system: HISTORY plot |
|
Last update: 2009-08-07T15:04:07 (UT)
|
|
|
|
|
*Date on this monitor changes at 21:00 UT |
|

|
|
|
Plot
? |
Symb
? |
Source
* |
Average ? |
Thresholds ? |
N_
data |
QC1
parameter |
Data
downloads |
Remarks |
| method |
value |
unit |
method |
value |
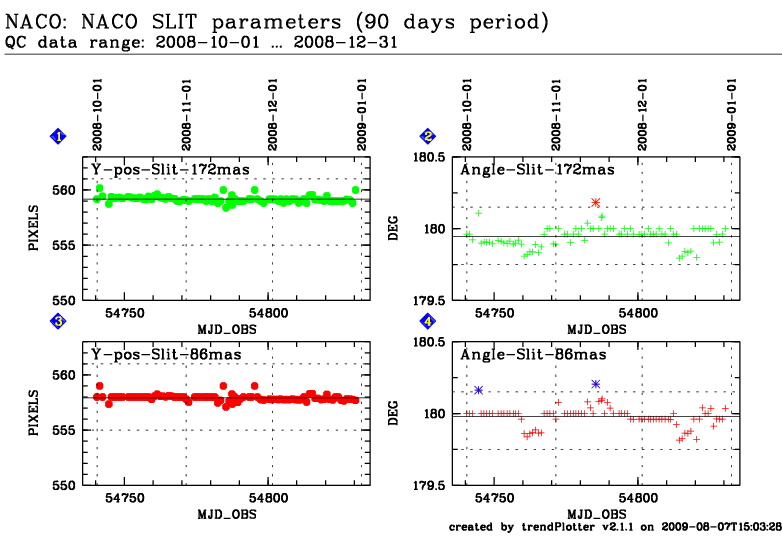
| 1 |
• | QC1DB |
MEAN |
559.17957 |
|
VAL | 555,561 |
87 |
slit_ypos |
this |
last_yr |
all
|
NACO Slit_172mas - Y-Position |
| 2 |
+ | QC1DB |
MEAN |
179.94604 |
|
VAL | 179.75,180.15 |
87 |
slit_posang |
this |
last_yr |
all
|
NACO Slit_172mas - Angle |
| 3 |
• | QC1DB |
MEAN |
557.92609 |
|
VAL | 555,561 |
87 |
slit_ypos |
this |
last_yr |
all
|
NACO Slit_86mas - Y-Position |
| 4 |
+ | QC1DB |
MEAN |
179.97928 |
|
VAL | 179.75,180.15 |
87 |
slit_posang |
this |
last_yr |
all
|
NACO Slit_86mas - Angle |
| |
|
*Data sources: QC1DB: QC1 database; LOCAL: local text file
|
General information
Click on any of the plots to see a close-up version.
The latest date is indicated on top of the plot, data points belonging to that date are specially marked.
If configured,
- statistical averages are indicated by a solid line, and thresholds by broken lines
- outliers are marked by a red asterisk. They are defined as data points outside the
threshold lines
- "aliens" (= data points outside the plot Y limits) are marked by a red arrow (↑ or ↓)
- you can download the data for each parameter set if the 'Data downloads' link shows up
|
|