[page auto-refreshes after 60 sec]
[press Ctrl+R to enforce refresh of scores and dates]
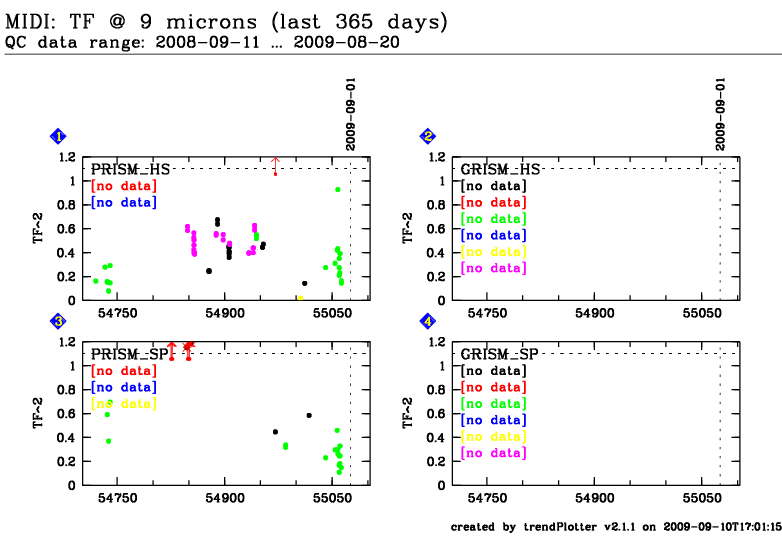
MIDI trending system: HEALTH CHECK plot
Last update: 2009-09-10T17:15:39 (UT)
[enable javascript for displaying time difference!]
| now:
2024-07-17T10:55:47
(UT)
[an error occurred while processing this directive]
no OPSLOG data space Plot:
N_data:
*Date on this monitor changes at 21:00 UT
Plot? Symb? Source OPS? Average ? Thresholds ? N_ QC1 Data Remarks
method value unit method value
1
• QC1DB no none NONE VAL 0.0,1.1 15 TF_bin2
this |
last_yr |
all
alfhya
1
• QC1DB no none NONE VAL 0.0,1.1 0 TF_bin2
this |
last_yr |
all
alftau
1
• QC1DB no none NONE VAL 0.0,1.1 22 TF_bin2
this |
last_yr |
all
etasgr
1
• QC1DB no none NONE VAL 0.0,1.1 0 TF_bin2
this |
last_yr |
all
alfboo
1
• QC1DB no none NONE VAL 0.0,1.1 1 TF_bin2
this |
last_yr |
all
siglib
1
• QC1DB no none NONE VAL 0.0,1.1 24 TF_bin2
this |
last_yr |
all
alfcma
2
• QC1DB no none NONE VAL 0.0,1.1 0 TF_bin2
this |
last_yr |
all
alfhya
2
• QC1DB no none NONE VAL 0.0,1.1 0 TF_bin2
this |
last_yr |
all
alftau
2
• QC1DB no none NONE VAL 0.0,1.1 0 TF_bin2
this |
last_yr |
all
etasgr
2
• QC1DB no none NONE VAL 0.0,1.1 0 TF_bin2
this |
last_yr |
all
alfboo
2
• QC1DB no none NONE VAL 0.0,1.1 0 TF_bin2
this |
last_yr |
all
siglib
2
• QC1DB no none NONE VAL 0.0,1.1 0 TF_bin2
this |
last_yr |
all
alfcma
3
• QC1DB no none NONE VAL 0.0,1.1 7 TF_bin2
this |
last_yr |
all
alfhya
3
• QC1DB no none NONE VAL 0.0,1.1 0 TF_bin2
this |
last_yr |
all
alftau
3
• QC1DB no none NONE VAL 0.0,1.1 17 TF_bin2
this |
last_yr |
all
etasgr
3
• QC1DB no none NONE VAL 0.0,1.1 0 TF_bin2
this |
last_yr |
all
alfboo
3
• QC1DB no none NONE VAL 0.0,1.1 0 TF_bin2
this |
last_yr |
all
siglib
3
• QC1DB no none NONE VAL 0.0,1.1 3 TF_bin2
this |
last_yr |
all
alfcma
4
• QC1DB no none NONE VAL 0.0,1.1 0 TF_bin2
this |
last_yr |
all
alfhya
4
• QC1DB no none NONE VAL 0.0,1.1 0 TF_bin2
this |
last_yr |
all
alftau
4
• QC1DB no none NONE VAL 0.0,1.1 0 TF_bin2
this |
last_yr |
all
etasgr
4
• QC1DB no none NONE VAL 0.0,1.1 0 TF_bin2
this |
last_yr |
all
alfboo
4
• QC1DB no none NONE VAL 0.0,1.1 0 TF_bin2
this |
last_yr |
all
siglib
4
• QC1DB no none NONE VAL 0.0,1.1 0 TF_bin2
this |
last_yr |
all
alfcma
*Data sources: QC1DB: QC1 database; LOCAL: local text file | **OPS: to indicate that OPSLOG data are included
General information
Click on any of the plots to see a close-up version .
The latest date is indicated on top of the plot, data points belonging to that date are specially marked.
If configured,
statistical averages are indicated by a solid line, and thresholds by broken lines outliers are marked by a red asterisk. They are defined as data points outside the
threshold lines "aliens" (= data points outside the plot Y limits) are marked by a red arrow (↑ ↓ you can download the data for each parameter set if the 'Data downloads' link shows up
