*Data sources: QC1DB: QC1 database; LOCAL: local text file | **OPS: to indicate that OPSLOG data are included
This plot
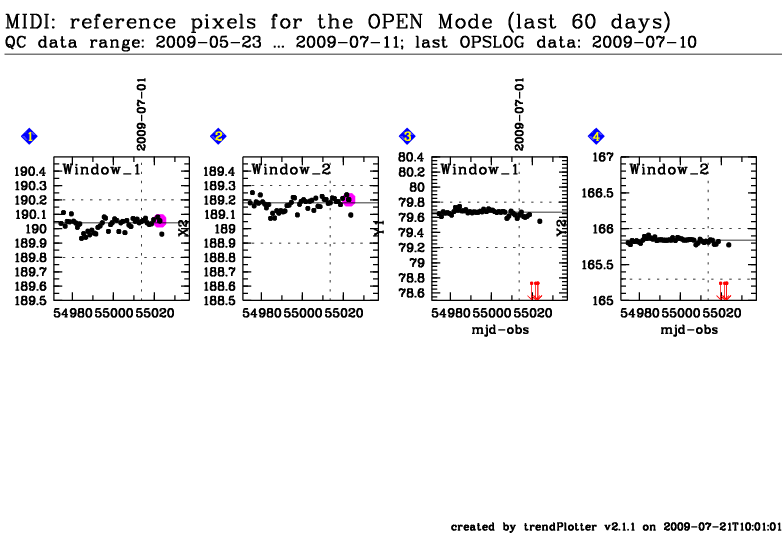
The reference pixels of MIDI are the two pixels of the detector onto
which the centroids of the target images must fall in order to ensure a
proper beam overlap. They are measured using the center of a pinhole,
in the 3 set-ups OPEN, HIGH_SENS and SCI_PHOT, for telescopes beams A
and B feeding MIDI, for the interferometric channnels 1 and 2 of MIDI,
and for the photometric channels PA and PB of MIDI (in SCI_PHOT only).
General information
Click on any of the plots to see a close-up version.
If applicable, the latest values from Paranal ops logs are plotted as blue dots. More information about those values, including a download option, is available in the OPS column.
The latest date is indicated on top of the plot, data points belonging to that date are specially marked.
If configured,
statistical averages are indicated by a solid line, and thresholds by broken lines
outliers are marked by a red asterisk. They are defined as data points outside the
threshold lines
"aliens" (= data points outside the plot Y limits) are marked by a red arrow (↑ or ↓)
you can download the data for each parameter set if the 'Data downloads' link shows up
