*Data sources: QC1DB: QC1 database; LOCAL: local text file | **OPS: to indicate that OPSLOG data are included
Plot 1 scores: [an error occurred while processing this directive]
data source:
local text file
parameter | dataset: (numbers applicable to • )
x
•
mean:
no data
percent
fixed thresholds:
0.0...50.0
percent
N_data:
0
[click on plot for closeup]
Plot 2 scores: [an error occurred while processing this directive]
data source:
local text file
parameter | dataset: (numbers applicable to • )
x
•
mean:
no data
percent*100
fixed thresholds:
0.0...0.01
percent*100
N_data:
0
[click on plot for closeup]
Plot 3 scores: [an error occurred while processing this directive]
data source:
local text file
parameter | dataset: (numbers applicable to • )
x
•
average:
none
thresholds:
none
N_data:
0
[click on plot for closeup]
This plot
[an error occurred while processing this directive]
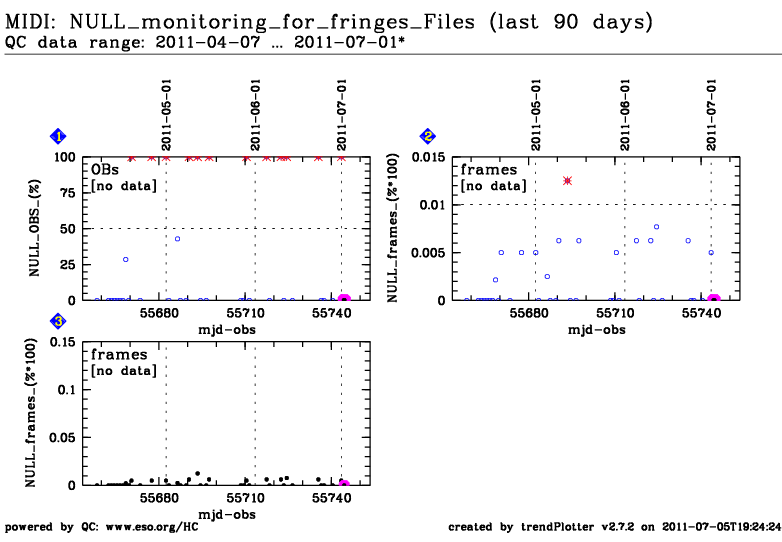
General information
Click on any of the plots to see a close-up version.
The latest date is indicated on top of the plot, data points belonging to that date are specially marked.
If configured,
statistical averages are indicated by a solid line, and thresholds by broken lines
outliers are marked by a red asterisk. They are defined as data points outside the
threshold lines
"aliens" (= data points outside the plot Y limits) are marked by a red arrow (↑ or ↓)
you can download the data for each parameter set if the 'Data downloads' link shows up


