Plot
? |
Symb
? |
Source
* |
OPS?
** |
Average ? |
Thresholds ? |
N_
data |
QC1
parameter |
Data
downloads |
Remarks |
| method |
value |
unit |
method |
value |
| 1 |
• | LOCAL |
no |
MEDIAN |
19.02623 |
NONE |
VAL | 12,20 |
20 |
x |
n/a |
|
| 1 |
• | QC1DB |
no |
MEAN |
19.27701 |
NONE |
VAL | 12,20 |
6 |
y1_cent_bin3 |
all (full time range)
| |
| 2 |
• | LOCAL |
no |
MEDIAN |
18.86055 |
NONE |
VAL | 12,20 |
20 |
x |
n/a |
|
| 2 |
• | QC1DB |
no |
MEAN |
18.84017 |
NONE |
VAL | 12,20 |
6 |
y2_cent_bin3 |
all (full time range)
| |
| |
|
*Data sources: QC1DB: QC1 database; LOCAL: local text file | **OPS: to indicate that OPSLOG data are included
|
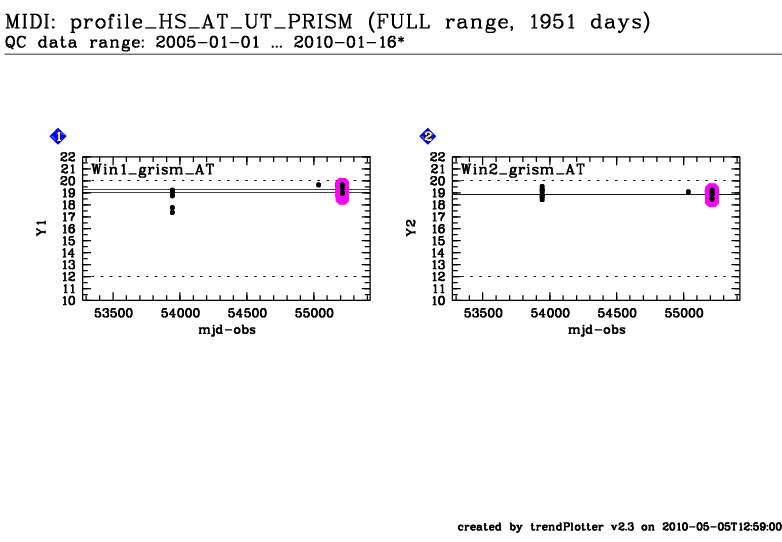
This plot
The recipe midi_profile is applied to chopped PHOTOMETRY frames. For
each window on the detector (Data1, Data2 for HIGH_SENS) and Data1 to
Data4 for SCI_PHOT, a profile is identified and a mask is created. The
recipe also calculates the y position of the mask in 5 different bins
These results are used to monitor the vertical position of the
spectrum (using the bin 3: HIERARCH ESO QC Y1 CENT BINNED3). A
problem has been detected with the PRISM (the y position is moving 1
pixel per year).
General information
Click on any of the plots to see a close-up version.
The latest date is indicated on top of the plot, data points belonging to that date are specially marked.
If configured,
- statistical averages are indicated by a solid line, and thresholds by broken lines
- outliers are marked by a red asterisk. They are defined as data points outside the
threshold lines
- "aliens" (= data points outside the plot Y limits) are marked by a red arrow (↑ or ↓)
- you can download the data for each parameter set if the 'Data downloads' link shows up
|
