|
|
| MIDI trending system: FULL report |
|
Last update: 2012-01-01T00:17:08 (UT)
|
|
|
[an error occurred while processing this directive]

|
| Print: |
Information and research: |
|
- png file
|
- advanced studies:
QC1 browser |
QC1 plotter
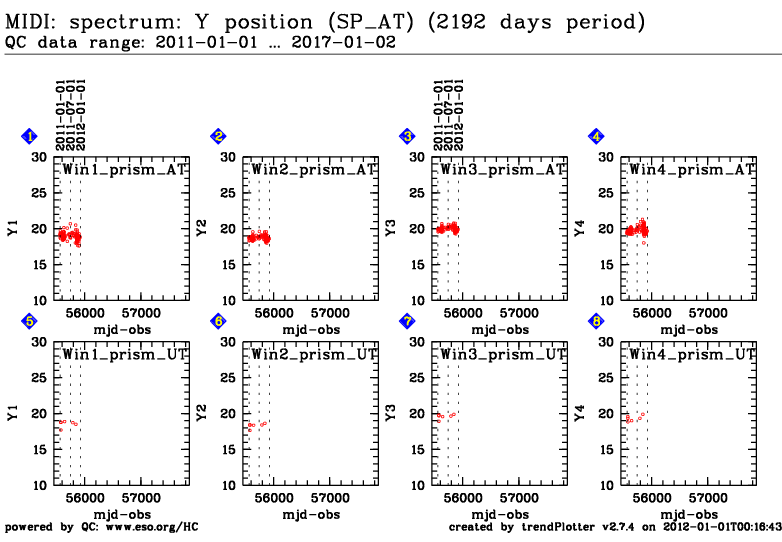
- general comment: The position of the PRISM spectrum is slowly shifting down (1 px per year).
|
|
| Plot 1 | | data source: | midi_profile_SP
(QC1 database) |
| dataset: | y1_cent_bin3 | o |
| average: | none |
| thresholds: | none |
| N_data plotted: | 160 |
| [click on plot for closeup] |
| Plot 2 | | data source: | midi_profile_SP
(QC1 database) |
| dataset: | y2_cent_bin3 | o |
| average: | none |
| thresholds: | none |
| N_data plotted: | 160 |
| [click on plot for closeup] |
| Plot 3 | | data source: | midi_profile_SP
(QC1 database) |
| dataset: | y3_cent_bin3 | o |
| average: | none |
| thresholds: | none |
| N_data plotted: | 160 |
| [click on plot for closeup] |
| Plot 4 | | data source: | midi_profile_SP
(QC1 database) |
| dataset: | y4_cent_bin3 | o |
| average: | none |
| thresholds: | none |
| N_data plotted: | 160 |
| [click on plot for closeup] |
| Plot 5 | | data source: | midi_profile_SP
(QC1 database) |
| dataset: | y1_cent_bin3 | o |
| average: | none |
| thresholds: | none |
| N_data plotted: | 6 |
| [click on plot for closeup] |
| Plot 6 | | data source: | midi_profile_SP
(QC1 database) |
| dataset: | y2_cent_bin3 | o |
| average: | none |
| thresholds: | none |
| N_data plotted: | 6 |
| [click on plot for closeup] |
| Plot 7 | | data source: | midi_profile_SP
(QC1 database) |
| dataset: | y3_cent_bin3 | o |
| average: | none |
| thresholds: | none |
| N_data plotted: | 6 |
| [click on plot for closeup] |
| Plot 8 | | data source: | midi_profile_SP
(QC1 database) |
| dataset: | y4_cent_bin3 | o |
| average: | none |
| thresholds: | none |
| N_data plotted: | 6 |
| [click on plot for closeup] |
The recipe midi_profile is applied to chopped PHOTOMETRY frames. For
each window on the detector (Data1, Data2 for HIGH_SENS) and Data1 to
Data4 for SCI_PHOT, a profile is identified and a mask is created. The
recipe also calculates the y position of the mask in 5 different bins
These results are used to monitor the vertical position of the
spectrum (using the bin 3: HIERARCH ESO QC Y1 CENT BINNED3). A
problem has been detected with the PRISM (the y position is moving 1
pixel per year).
General information
Click on any of the plots to see a close-up version.
The latest date is indicated on top of the plot, data points belonging to that date are specially marked.
If configured,
- statistical averages are indicated by a solid line, and thresholds by broken lines
- outliers are marked by a red asterisk. They are defined as data points outside the
threshold lines
- "aliens" (= data points outside the plot Y limits) are marked by a red arrow (↑ or ↓)
- you can download the data for each parameter set if the 'Data downloads' link shows up
|