|
|
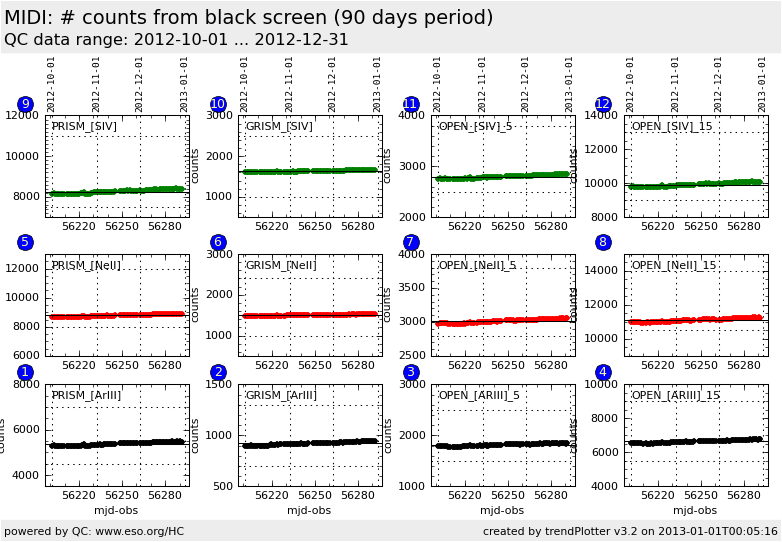
| MIDI trending system: HISTORY report |
|
|
|
Last update: 2013-01-01T00:05:31 (UT)
|
|
|
|
|
*Date on this monitor changes at 21:00 UT |
|

|
|
|
Plot
? |
Symb
? |
Source
* |
Average ? |
Thresholds ? |
N_
data |
QC1
parameter |
Data
downloads |
Remarks |
| method |
value |
unit |
method |
value |
| 1 |
• | QC1DB |
MEDIAN |
5.38e+03 |
number_counts |
VAL | 4500,7000 |
88 |
disp4_number_counts |
this |
last_yr |
all
|
[ARIII] filter with prism |
| 2 |
• | QC1DB |
MEDIAN |
923 |
number_counts |
VAL | 700,1300 |
87 |
disp4_number_counts |
this |
last_yr |
all
|
[ARIII] filter with grism |
| 3 |
• | QC1DB |
MEDIAN |
1.81e+03 |
number_counts |
VAL | 1500,2500 |
87 |
image1_number_counts |
this |
last_yr |
all
|
[ARIII] filter open |
| 4 |
• | QC1DB |
MEDIAN |
6.64e+03 |
number_counts |
VAL | 5500,9000 |
88 |
image1_number_counts |
this |
last_yr |
all
|
[ARIII] filter open |
| 5 |
• | QC1DB |
MEDIAN |
8.78e+03 |
number_counts |
VAL | 8000,12000 |
88 |
disp5_number_counts |
this |
last_yr |
all
|
[NeII] filter with prism |
| 6 |
• | QC1DB |
MEDIAN |
1.5e+03 |
number_counts |
VAL | 1000,2400 |
87 |
disp5_number_counts |
this |
last_yr |
all
|
[NeII] filter with grism |
| 7 |
• | QC1DB |
MEDIAN |
3.01e+03 |
number_counts |
VAL | 2800,3800 |
87 |
image2_number_counts |
this |
last_yr |
all
|
[NeII] filter open |
| 8 |
• | QC1DB |
MEDIAN |
1.11e+04 |
number_counts |
VAL | 10500,14000 |
88 |
image2_number_counts |
this |
last_yr |
all
|
[NeII] filter open |
| 9 |
• | QC1DB |
MEDIAN |
8.27e+03 |
number_counts |
VAL | 7500,11000 |
88 |
disp6_number_counts |
this |
last_yr |
all
|
[SIV] filter with prism |
| 10 |
• | QC1DB |
MEDIAN |
1.63e+03 |
number_counts |
VAL | 1000,2500 |
87 |
disp6_number_counts |
this |
last_yr |
all
|
[SIV] filter with grism |
| 11 |
• | QC1DB |
MEDIAN |
2.8e+03 |
number_counts |
VAL | 2500,3800 |
87 |
image3_number_counts |
this |
last_yr |
all
|
[SIV] filter open |
| 12 |
• | QC1DB |
MEDIAN |
9.93e+03 |
number_counts |
VAL | 9000,13000 |
88 |
image3_number_counts |
this |
last_yr |
all
|
[SIV] filter open |
| |
|
*Data sources: QC1DB: QC1 database; LOCAL: local text file
|
| Plot 1 | | data source: | midi_dettrn
(QC1 database) |
| dataset: | disp4_number_counts | • |
| median: | 5.38e+03 | number_counts |
| fixed thresholds: | 4500...7000 | number_counts |
| N_data plotted: | 88 |
| [click on plot for closeup] |
| Plot 2 | | data source: | midi_dettrn
(QC1 database) |
| dataset: | disp4_number_counts | • |
| median: | 923 | number_counts |
| fixed thresholds: | 700...1300 | number_counts |
| N_data plotted: | 87 |
| [click on plot for closeup] |
| Plot 3 | | data source: | midi_dettrn
(QC1 database) |
| dataset: | image1_number_counts | • |
| median: | 1.81e+03 | number_counts |
| fixed thresholds: | 1500...2500 | number_counts |
| N_data plotted: | 87 |
| [click on plot for closeup] |
| Plot 4 | | data source: | midi_dettrn
(QC1 database) |
| dataset: | image1_number_counts | • |
| median: | 6.64e+03 | number_counts |
| fixed thresholds: | 5500...9000 | number_counts |
| N_data plotted: | 88 |
| [click on plot for closeup] |
| Plot 5 | | data source: | midi_dettrn
(QC1 database) |
| dataset: | disp5_number_counts | • |
| median: | 8.78e+03 | number_counts |
| fixed thresholds: | 8000...12000 | number_counts |
| N_data plotted: | 88 |
| [click on plot for closeup] |
| Plot 6 | | data source: | midi_dettrn
(QC1 database) |
| dataset: | disp5_number_counts | • |
| median: | 1.5e+03 | number_counts |
| fixed thresholds: | 1000...2400 | number_counts |
| N_data plotted: | 87 |
| [click on plot for closeup] |
| Plot 7 | | data source: | midi_dettrn
(QC1 database) |
| dataset: | image2_number_counts | • |
| median: | 3.01e+03 | number_counts |
| fixed thresholds: | 2800...3800 | number_counts |
| N_data plotted: | 87 |
| [click on plot for closeup] |
| Plot 8 | | data source: | midi_dettrn
(QC1 database) |
| dataset: | image2_number_counts | • |
| median: | 1.11e+04 | number_counts |
| fixed thresholds: | 10500...14000 | number_counts |
| N_data plotted: | 88 |
| [click on plot for closeup] |
| Plot 9 | | data source: | midi_dettrn
(QC1 database) |
| dataset: | disp6_number_counts | • |
| median: | 8.27e+03 | number_counts |
| fixed thresholds: | 7500...11000 | number_counts |
| N_data plotted: | 88 |
| [click on plot for closeup] |
| Plot 10 | | data source: | midi_dettrn
(QC1 database) |
| dataset: | disp6_number_counts | • |
| median: | 1.63e+03 | number_counts |
| fixed thresholds: | 1000...2500 | number_counts |
| N_data plotted: | 87 |
| [click on plot for closeup] |
| Plot 11 | | data source: | midi_dettrn
(QC1 database) |
| dataset: | image3_number_counts | • |
| median: | 2.8e+03 | number_counts |
| fixed thresholds: | 2500...3800 | number_counts |
| N_data plotted: | 87 |
| [click on plot for closeup] |
| Plot 12 | | data source: | midi_dettrn
(QC1 database) |
| dataset: | image3_number_counts | • |
| median: | 9.93e+03 | number_counts |
| fixed thresholds: | 9000...13000 | number_counts |
| N_data plotted: | 88 |
| [click on plot for closeup] |
The number of counts is used to calculate the transmission of the dispersive elements. Transmission PRISM=(counts PRISM)/(counts OPEN, DIT=15ms). Transmission GRISM=(counts GRISM)/(counts OPEN, DIT=5ms)
General information
Click on any of the plots to see a close-up version.
The latest date is indicated on top of the plot, data points belonging to that date are specially marked.
If configured,
- statistical averages are indicated by a solid line, and thresholds by broken lines
- outliers are marked by a red asterisk. They are defined as data points outside the
threshold lines
- "aliens" (= data points outside the plot Y limits) are marked by a red arrow (↑ or ↓)
- you can download the data for each parameter set if the 'Data downloads' link shows up
|
|