Plot
? |
Symb
? |
Source
* |
Average ? |
Thresholds ? |
N_
data |
QC1
parameter |
Data
downloads |
Remarks |
| method |
value |
unit |
method |
value |
| 1 |
• | QC1DB |
MEDIAN |
5324.22998 |
number_counts |
VAL | 4500,7000 |
89 |
disp4_number_counts |
this |
last_yr |
all
|
[ARIII] filter with prism |
| 2 |
• | QC1DB |
MEDIAN |
932.76001 |
number_counts |
VAL | 700,1300 |
89 |
disp4_number_counts |
this |
last_yr |
all
|
[ARIII] filter with grism |
| 3 |
• | QC1DB |
MEDIAN |
1804.91003 |
number_counts |
VAL | 1500,2500 |
89 |
image1_number_counts |
this |
last_yr |
all
|
[ARIII] filter open |
| 4 |
• | QC1DB |
MEDIAN |
6575.93018 |
number_counts |
VAL | 5500,9000 |
89 |
image1_number_counts |
this |
last_yr |
all
|
[ARIII] filter open |
| 5 |
• | QC1DB |
MEDIAN |
8747.66992 |
number_counts |
VAL | 8000,12000 |
89 |
disp5_number_counts |
this |
last_yr |
all
|
[NeII] filter with prism |
| 6 |
• | QC1DB |
MEDIAN |
1526.45996 |
number_counts |
VAL | 1000,2400 |
89 |
disp5_number_counts |
this |
last_yr |
all
|
[NeII] filter with grism |
| 7 |
• | QC1DB |
MEDIAN |
3009.36011 |
number_counts |
VAL | 2800,3800 |
89 |
image2_number_counts |
this |
last_yr |
all
|
[NeII] filter open |
| 8 |
• | QC1DB |
MEDIAN |
11079.40039 |
number_counts |
VAL | 10500,14000 |
89 |
image2_number_counts |
this |
last_yr |
all
|
[NeII] filter open |
| 9 |
• | QC1DB |
MEDIAN |
8228.80957 |
number_counts |
VAL | 7500,11000 |
89 |
disp6_number_counts |
this |
last_yr |
all
|
[SIV] filter with prism |
| 10 |
• | QC1DB |
MEDIAN |
1649.30005 |
number_counts |
VAL | 1000,2500 |
89 |
disp6_number_counts |
this |
last_yr |
all
|
[SIV] filter with grism |
| 11 |
• | QC1DB |
MEDIAN |
2794.31006 |
number_counts |
VAL | 2500,3800 |
89 |
image3_number_counts |
this |
last_yr |
all
|
[SIV] filter open |
| 12 |
• | QC1DB |
MEDIAN |
9900.67969 |
number_counts |
VAL | 9000,13000 |
89 |
image3_number_counts |
this |
last_yr |
all
|
[SIV] filter open |
| |
|
*Data sources: QC1DB: QC1 database; LOCAL: local text file
|
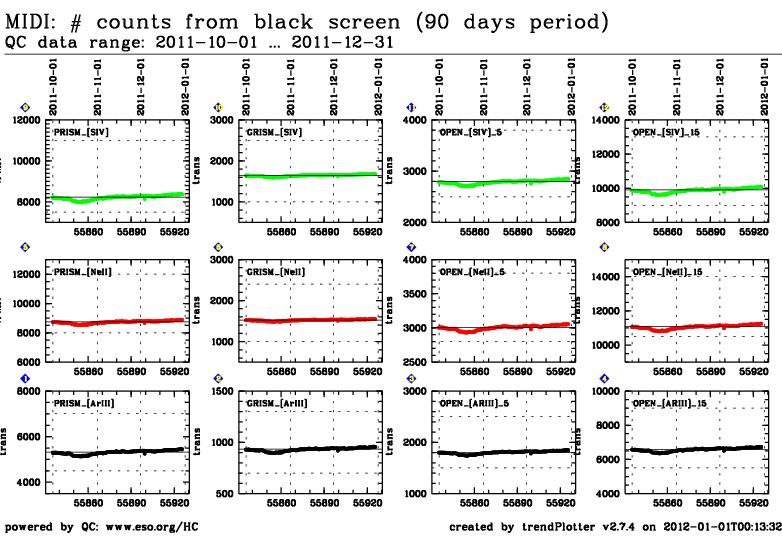
| Plot 1 | | data source: | midi_dettrn
(QC1 database) |
| dataset: | disp4_number_counts | • |
| median: | 5324.22998 | number_counts |
| fixed thresholds: | 4500.0...7000.0 | number_counts |
| N_data plotted: | 89 |
| [click on plot for closeup] |
| Plot 2 | | data source: | midi_dettrn
(QC1 database) |
| dataset: | disp4_number_counts | • |
| median: | 932.76001 | number_counts |
| fixed thresholds: | 700.0...1300.0 | number_counts |
| N_data plotted: | 89 |
| [click on plot for closeup] |
| Plot 3 | | data source: | midi_dettrn
(QC1 database) |
| dataset: | image1_number_counts | • |
| median: | 1804.91003 | number_counts |
| fixed thresholds: | 1500.0...2500.0 | number_counts |
| N_data plotted: | 89 |
| [click on plot for closeup] |
| Plot 4 | | data source: | midi_dettrn
(QC1 database) |
| dataset: | image1_number_counts | • |
| median: | 6575.93018 | number_counts |
| fixed thresholds: | 5500.0...9000.0 | number_counts |
| N_data plotted: | 89 |
| [click on plot for closeup] |
| Plot 5 | | data source: | midi_dettrn
(QC1 database) |
| dataset: | disp5_number_counts | • |
| median: | 8747.66992 | number_counts |
| fixed thresholds: | 8000.0...12000.0 | number_counts |
| N_data plotted: | 89 |
| [click on plot for closeup] |
| Plot 6 | | data source: | midi_dettrn
(QC1 database) |
| dataset: | disp5_number_counts | • |
| median: | 1526.45996 | number_counts |
| fixed thresholds: | 1000.0...2400.0 | number_counts |
| N_data plotted: | 89 |
| [click on plot for closeup] |
| Plot 7 | | data source: | midi_dettrn
(QC1 database) |
| dataset: | image2_number_counts | • |
| median: | 3009.36011 | number_counts |
| fixed thresholds: | 2800.0...3800.0 | number_counts |
| N_data plotted: | 89 |
| [click on plot for closeup] |
| Plot 8 | | data source: | midi_dettrn
(QC1 database) |
| dataset: | image2_number_counts | • |
| median: | 11079.40039 | number_counts |
| fixed thresholds: | 10500.0...14000.0 | number_counts |
| N_data plotted: | 89 |
| [click on plot for closeup] |
| Plot 9 | | data source: | midi_dettrn
(QC1 database) |
| dataset: | disp6_number_counts | • |
| median: | 8228.80957 | number_counts |
| fixed thresholds: | 7500.0...11000.0 | number_counts |
| N_data plotted: | 89 |
| [click on plot for closeup] |
| Plot 10 | | data source: | midi_dettrn
(QC1 database) |
| dataset: | disp6_number_counts | • |
| median: | 1649.30005 | number_counts |
| fixed thresholds: | 1000.0...2500.0 | number_counts |
| N_data plotted: | 89 |
| [click on plot for closeup] |
| Plot 11 | | data source: | midi_dettrn
(QC1 database) |
| dataset: | image3_number_counts | • |
| median: | 2794.31006 | number_counts |
| fixed thresholds: | 2500.0...3800.0 | number_counts |
| N_data plotted: | 89 |
| [click on plot for closeup] |
| Plot 12 | | data source: | midi_dettrn
(QC1 database) |
| dataset: | image3_number_counts | • |
| median: | 9900.67969 | number_counts |
| fixed thresholds: | 9000.0...13000.0 | number_counts |
| N_data plotted: | 89 |
| [click on plot for closeup] |
The number of counts is used to calculate the transmission of the dispersive elements. Transmission PRISM=(counts PRISM)/(counts OPEN, DIT=15ms). Transmission GRISM=(counts GRISM)/(counts OPEN, DIT=5ms)
General information
Click on any of the plots to see a close-up version.
The latest date is indicated on top of the plot, data points belonging to that date are specially marked.
If configured,
- statistical averages are indicated by a solid line, and thresholds by broken lines
- outliers are marked by a red asterisk. They are defined as data points outside the
threshold lines
- "aliens" (= data points outside the plot Y limits) are marked by a red arrow (↑ or ↓)
- you can download the data for each parameter set if the 'Data downloads' link shows up
|
