Plot
? |
Symb
? |
Source
* |
Average ? |
Thresholds ? |
N_
data |
QC1
parameter |
Data
downloads |
Remarks |
| method |
value |
unit |
method |
value |
| 1 |
• | QC1DB |
MEDIAN |
0.77765 |
NONE |
VAL | 0.74,1.00 |
39 |
disp4_transmission |
this |
last_yr |
all
|
prism [ARIII] |
| 2 |
• | QC1DB |
MEDIAN |
0.79296 |
NONE |
VAL | 0.76,1.00 |
39 |
disp5_transmission |
this |
last_yr |
all
|
prism [NeII] |
| 3 |
• | QC1DB |
MEDIAN |
0.82832 |
NONE |
VAL | 0.78,1.00 |
39 |
disp6_transmission |
this |
last_yr |
all
|
prism [SIV] |
| 4 |
• | QC1DB |
MEDIAN |
0.52007 |
NONE |
VAL | 0.4,1.00 |
39 |
disp4_transmission |
this |
last_yr |
all
|
grism [ARIII] |
| 5 |
• | QC1DB |
MEDIAN |
0.5132 |
NONE |
VAL | 0.4,1.00 |
39 |
disp5_transmission |
this |
last_yr |
all
|
grism [NeII] |
| 6 |
• | QC1DB |
MEDIAN |
0.58961 |
NONE |
VAL | 0.4,1.00 |
39 |
disp6_transmission |
this |
last_yr |
all
|
grism [SIV] |
| |
|
*Data sources: QC1DB: QC1 database; LOCAL: local text file
|
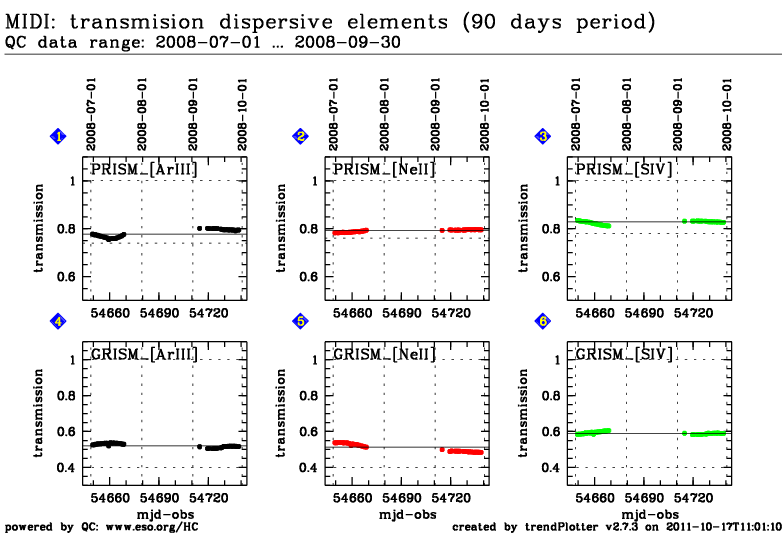
| Plot 1 | | data source: | midi_dettrn
(QC1 database) |
| dataset: | disp4_transmission | • |
| median: | 0.77765 | NONE |
| fixed thresholds: | 0.74...1.0 | NONE |
| N_data plotted: | 39 |
| [click on plot for closeup] |
| Plot 2 | | data source: | midi_dettrn
(QC1 database) |
| dataset: | disp5_transmission | • |
| median: | 0.79296 | NONE |
| fixed thresholds: | 0.76...1.0 | NONE |
| N_data plotted: | 39 |
| [click on plot for closeup] |
| Plot 3 | | data source: | midi_dettrn
(QC1 database) |
| dataset: | disp6_transmission | • |
| median: | 0.82832 | NONE |
| fixed thresholds: | 0.78...1.0 | NONE |
| N_data plotted: | 39 |
| [click on plot for closeup] |
| Plot 4 | | data source: | midi_dettrn
(QC1 database) |
| dataset: | disp4_transmission | • |
| median: | 0.52007 | NONE |
| fixed thresholds: | 0.4...1.0 | NONE |
| N_data plotted: | 39 |
| [click on plot for closeup] |
| Plot 5 | | data source: | midi_dettrn
(QC1 database) |
| dataset: | disp5_transmission | • |
| median: | 0.5132 | NONE |
| fixed thresholds: | 0.4...1.0 | NONE |
| N_data plotted: | 39 |
| [click on plot for closeup] |
| Plot 6 | | data source: | midi_dettrn
(QC1 database) |
| dataset: | disp6_transmission | • |
| median: | 0.58961 | NONE |
| fixed thresholds: | 0.4...1.0 | NONE |
| N_data plotted: | 39 |
| [click on plot for closeup] |
MIDI has 2 dispersive elements a prism (R=30) and a grism (R=230). The transmission of each element is measured through narrow-band filters at three wavelengths (9.00, 10.46 and 12.80 microns). Measurement through the same filters but without the dispersion are also performed to normalize the transmission.
General information
Click on any of the plots to see a close-up version.
The latest date is indicated on top of the plot, data points belonging to that date are specially marked.
If configured,
- statistical averages are indicated by a solid line, and thresholds by broken lines
- outliers are marked by a red asterisk. They are defined as data points outside the
threshold lines
- "aliens" (= data points outside the plot Y limits) are marked by a red arrow (↑ or ↓)
- you can download the data for each parameter set if the 'Data downloads' link shows up
|
