|
|
| MIDI trending system: HISTORY plot |
|
Last update: 2011-08-10T01:08:29 (UT)
|
|
|
|
|
*Date on this monitor changes at 21:00 UT |
|

|
| Print: |
Information and research: |
|
- png file
|
- advanced studies:
QC1 browser |
QC1 plotter
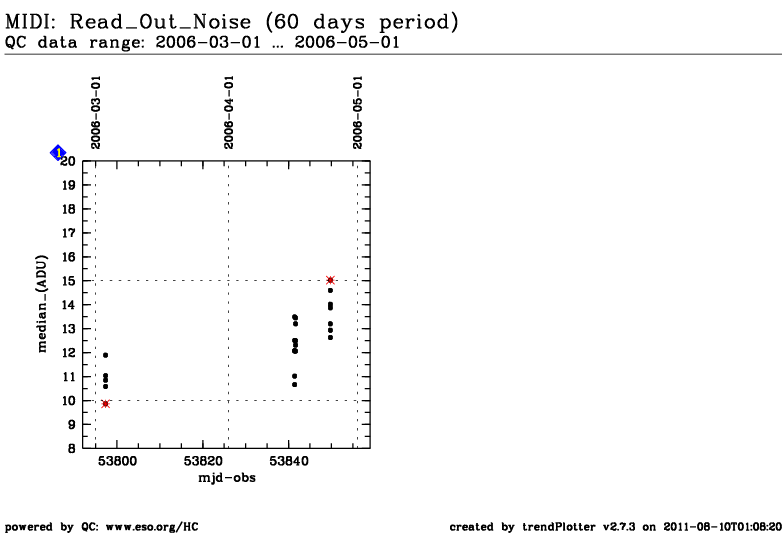
- general comment: Increase of the RON is often due to power cuts and/or high pressure (see pressure plot)
|
|
Plot
? |
Symb
? |
Source
* |
Average ? |
Thresholds ? |
N_
data |
QC1
parameter |
Data
downloads |
Remarks |
| method |
value |
unit |
method |
value |
| 1 |
• | QC1DB |
none |
|
ADU |
VAL | 10,15 |
23 |
median_masterron |
this |
last_yr |
all
|
read-out noise of master frame (ADU) |
| |
|
*Data sources: QC1DB: QC1 database; LOCAL: local text file
|
| Plot 1 | | data source: | midi_detron
(QC1 database) |
| dataset: | median_masterron | • |
| average: | none |
| fixed thresholds: | 10.0...15.0 | ADU |
| N_data plotted: | 23 |
| [click on plot for closeup] |
The readout noise of MIDI is monitored by taking a full-frame exposure
with a large number of frames, with the MIDI shutter closed and with a
minimum DIT. The standard deviation of the pixel level over the frames
is computed by the pipeline for each pixel, as well as the median of
the standard deviation over all the pixels and all the frames, which is
plotted here (expressed in detector ADUs).
General information
Click on any of the plots to see a close-up version.
The latest date is indicated on top of the plot, data points belonging to that date are specially marked.
If configured,
- statistical averages are indicated by a solid line, and thresholds by broken lines
- outliers are marked by a red asterisk. They are defined as data points outside the
threshold lines
- "aliens" (= data points outside the plot Y limits) are marked by a red arrow (↑ or ↓)
- you can download the data for each parameter set if the 'Data downloads' link shows up
|