Plot
? |
Symb
? |
Source
* |
OPS?
** |
Average ? |
Thresholds ? |
N_
data |
QC1
parameter |
Data
downloads |
Remarks |
| method |
value |
unit |
method |
value |
| 1 |
• | QC1DB |
no |
MEDIAN |
|
MAG/AS2 |
none | |
0 |
qc_iq |
all (full time range)
| Sky brightness for LW-arm J+Block filter |
| 2 |
• | QC1DB |
no |
MEDIAN |
0.62589 |
MAG/AS2 |
none | |
55 |
qc_iq |
all (full time range)
| Sky brightness for LW-arm, H filter |
| 3 |
• | QC1DB |
no |
MEDIAN |
0.563 |
MAG/AS2 |
none | |
74 |
qc_iq |
all (full time range)
| Sky brightness for LW-arm, Ks filter |
| 4 |
• | QC1DB |
no |
MEDIAN |
0.36599 |
MAG/AS2 |
none | |
285 |
qc_iq |
all (full time range)
| Sky brightness for LW-arm, L filter |
| 5 |
• | QC1DB |
no |
MEDIAN |
|
MAG/AS2 |
none | |
0 |
qc_iq |
all (full time range)
| Sky brightness for LW-arm, NB_3.21 filter chopping=True |
| 5 |
• | QC1DB |
no |
MEDIAN |
|
MAG/AS2 |
none | |
0 |
qc_iq |
all (full time range)
| Sky brightness for LW-arm, NB_3.21 filter chopping=False |
| 6 |
• | QC1DB |
no |
MEDIAN |
|
MAG/AS2 |
none | |
0 |
qc_iq |
all (full time range)
| Sky brightness for LW-arm, NB_3.28 filter chopping=True |
| 6 |
• | QC1DB |
no |
MEDIAN |
|
MAG/AS2 |
none | |
0 |
qc_iq |
all (full time range)
| Sky brightness for LW-arm, NB_3.28 filter chopping=False |
| 7 |
• | QC1DB |
no |
MEDIAN |
|
MAG/AS2 |
none | |
0 |
qc_iq |
all (full time range)
| Sky brightness for LW-arm, NB_3.80 filter |
| 8 |
• | QC1DB |
no |
MEDIAN |
|
MAG/AS2 |
none | |
0 |
qc_iq |
all (full time range)
| Sky brightness for LW-arm, NB_4.07 filter |
| |
|
*Data sources: QC1DB: QC1 database; LOCAL: local text file | **OPS: to indicate that OPSLOG data are included
|
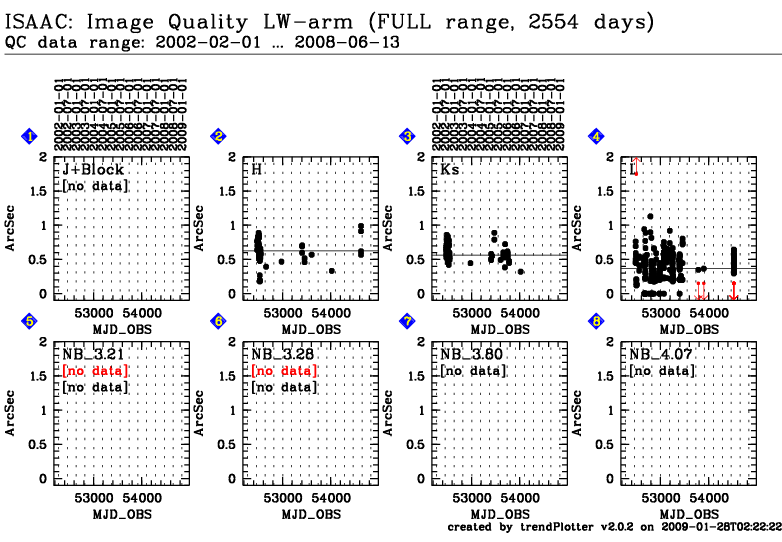
This plot
This is the trending plot for the ISAAC QC parameters derived from
science imaging pipeline products. The image quality is measured:
Sources are detected from the final imaging product:,br>
qc_fwhm_ac = median FWHM of all sources in arcsec
qc_fwhm_pix = median FWHM of all sources in pixel units
qc_mode = maximum of the FWHM histogram (most frequent FWHM)
qc_iq = specially cleaned mean of FWHM of all sources in arcsec
These plots describe qc_iq:
Fig. 1.image quality, for LW J+Block.
Fig. 2.image quality, for LW H.
Fig. 3.image quality, for LW Ks.
Fig. 4.image quality, for LW L.
Fig. 5.image quality, for LW N_3.21, chopping and jitter modes.
Fig. 6.image quality, for LW N_3.28, chopping and jitter modes.
Fig. 7.image quality, for LW N_3.80.
Fig. 8.image quality, for LW N_4.07.
Find more information about ISAAC science imaging products
here.
General information
Click on any of the plots to see a close-up version.
The latest date is indicated on top of the plot, data points belonging to that date are specially marked.
If configured,
- statistical averages are indicated by a solid line, and thresholds by broken lines
- outliers are marked by a red asterisk. They are defined as data points outside the
threshold lines
- "aliens" (= data points outside the plot Y limits) are marked by a red arrow (↑ or ↓)
- you can download the data for each parameter set if the 'Data downloads' link shows up
|
