|
|
| ISAAC trending system: HISTORY report |
|
|
|
Last update: 2013-08-30T20:22:49 (UT)
|
|
|
|
|
*Date on this monitor changes at 21:00 UT |
|

|
| Print: |
Information and research: |
|
- png file
|
- advanced studies:
QC1 browser |
QC1 plotter
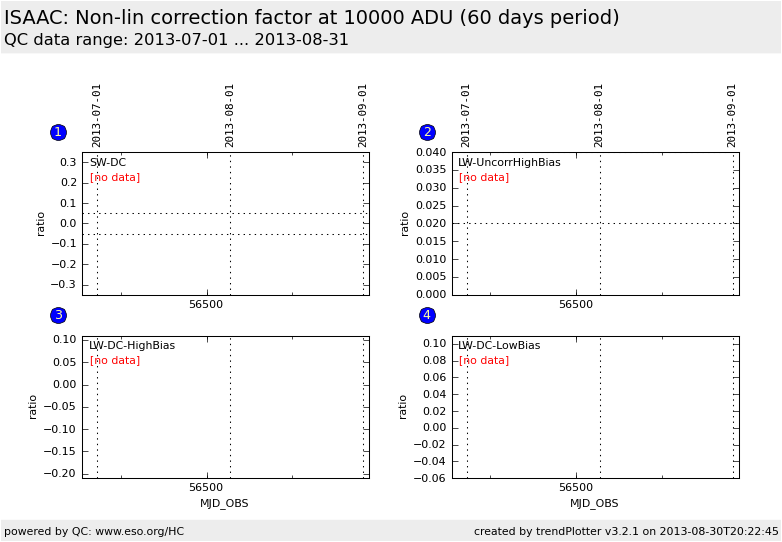
- From 2008-04 on the max counts is no longer 4000 ADU but 20000 ADU. The effective non-linearity correction at 10000 ADU is no longer an extrapolation.
|
|
Plot
? |
Symb
? |
Source
* |
Average ? |
Thresholds ? |
N_
data |
QC1
parameter |
Data
downloads |
Remarks |
| method |
value |
unit |
method |
value |
| 1 |
o | QC1DB |
MEDIAN |
|
ratio |
VAL | -0.05,0.05 |
0 |
qc_detlin_eff |
this |
last_yr |
all
|
SW-arm, DoubleCorr nonlinearity correction fraction at 10000 ADU |
| 2 |
o | QC1DB |
MEDIAN |
|
ratio |
VAL | 0.02,0.04 |
0 |
qc_detlin_eff |
this |
last_yr |
all
|
LW, UncorrHighBias nonlinearity correction fraction at 10000 ADU |
| 3 |
o | QC1DB |
MEDIAN |
|
ratio |
none | |
0 |
qc_detlin_eff |
this |
last_yr |
all
|
LW, DoubleCorrHighBias nonlinearity correction fraction at 10000 ADU |
| 4 |
o | QC1DB |
MEDIAN |
|
ratio |
none | |
0 |
qc_detlin_eff |
this |
last_yr |
all
|
LW, DoubleCorrLowBias nonlinearity correction fraction at 10000 ADU |
| |
|
*Data sources: QC1DB: QC1 database; LOCAL: local text file
|
| Plot 1 | | data source: | isaac_line
(QC1 database) |
| dataset: | qc_detlin_eff | o |
| median: | no data | ratio |
| fixed thresholds: | -0.05...0.05 | ratio |
| N_data plotted: | 0 |
| [click on plot for closeup] |
| Plot 2 | | data source: | isaac_line
(QC1 database) |
| dataset: | qc_detlin_eff | o |
| median: | no data | ratio |
| fixed thresholds: | 0.02...0.04 | ratio |
| N_data plotted: | 0 |
| [click on plot for closeup] |
| Plot 3 | | data source: | isaac_line
(QC1 database) |
| dataset: | qc_detlin_eff | o |
| median: | no data | ratio |
| thresholds: | none | |
| N_data plotted: | 0 |
| [click on plot for closeup] |
| Plot 4 | | data source: | isaac_line
(QC1 database) |
| dataset: | qc_detlin_eff | o |
| median: | no data | ratio |
| thresholds: | none | |
| N_data plotted: | 0 |
| [click on plot for closeup] |
Click on any of the plots to see a close-up version.
The latest date is indicated on top of the plot, data points belonging to that date are specially marked.
If configured,
- statistical averages are indicated by a solid line, and thresholds by broken lines
- outliers are marked by a red asterisk. They are defined as data points outside the
threshold lines
- "aliens" (= data points outside the plot Y limits) are marked by a red arrow (↑ or ↓)
- you can download the data for each parameter set if the 'Data downloads' link shows up
|