Plot
? |
Symb
? |
Source
* |
Average ? |
Thresholds ? |
N_
data |
QC1
parameter |
Data
downloads |
Remarks |
| method |
value |
unit |
method |
value |
| 1 |
. | LOCAL |
none |
|
T/K |
none | |
14060 |
SW1 |
n/a |
Hawaii-1 temperature sensor |
| 1 |
. | LOCAL |
none |
|
T/K |
none | |
14060 |
SW2 |
n/a |
Hawaii-2 temperature sensor |
| 2 |
. | LOCAL |
none |
|
T/K |
none | |
14060 |
LW1 |
n/a |
Aladdin-1 temperature sensor |
| |
|
*Data sources: QC1DB: QC1 database; LOCAL: local text file
|
| Plot 1 | | data source: | local text file
|
dataset:
(numbers below apply to this dataset) | SW1 | . |
| average: | none |
| thresholds: | none |
| N_data plotted: | 14060 |
| [click on plot for closeup] |
| Plot 2 | | data source: | local text file
|
| dataset: | LW1 | . |
| average: | none |
| thresholds: | none |
| N_data plotted: | 14060 |
| [click on plot for closeup] |
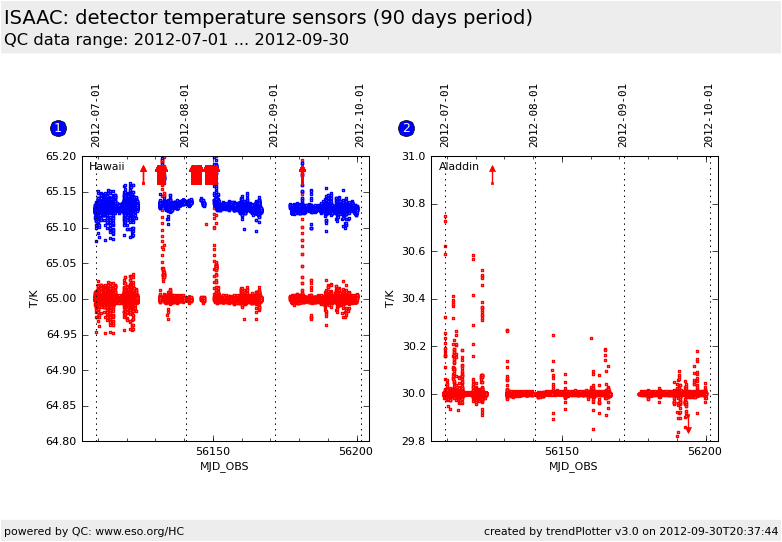
This is the trending plot for the ISAAC
detector temperature sensors.
These plots describe:
Fig. 1. temperature of the ISAAC
Hawaii detector (keyword INS.TEMP-DETSW) and the backup sensor
(blue) (keyword INS.TEMP-DETSW.CONTROL)
Fig. 2. temperature of the ISAAC Aladdin detector (keyword
INS.TEMP-DETLW). The Aladdin backup sensor is out of order since
2004-07-18.
Values are read from the ingested ISAAC raw frames fits headers.
General information
Click on any of the plots to see a close-up version.
The latest date is indicated on top of the plot, data points belonging to that date are specially marked.
If configured,
- statistical averages are indicated by a solid line, and thresholds by broken lines
- outliers are marked by a red asterisk. They are defined as data points outside the
threshold lines
- "aliens" (= data points outside the plot Y limits) are marked by a red arrow (↑ or ↓)
- you can download the data for each parameter set if the 'Data downloads' link shows up
|
