Plot
? |
Symb
? |
Source
* |
Average ? |
Thresholds ? |
N_
data |
QC1
parameter |
Data
downloads |
Remarks |
| method |
value |
unit |
method |
value |
| 1 |
• | QC1DB |
MEAN |
5.35801 |
|
VAL | 5.,5.9 |
81 |
ron12 |
this |
last_yr |
all
|
RON12 for DIT=2.0sec and DoubleCorrLowBias |
| 2 |
• | QC1DB |
MEAN |
5.3721 |
|
VAL | 5.,5.9 |
81 |
ron23 |
this |
last_yr |
all
|
RON23 for DIT=2.0sec and DoubleCorrLowBias |
| 3 |
• | QC1DB |
MEAN |
47.3897 |
ADU |
none | |
81 |
qc_darkmed |
this |
last_yr |
all
|
dark current for DIT=2.0sec and DoubleCorrLowBias |
| 4 |
• | QC1DB |
MEAN |
0.275853 |
|
VAL | 0,0.5 |
81 |
qc_dark_stdev |
this |
last_yr |
all
|
raw framedark RMS for DIT=2.0sec and DoubleCorrLowBias |
| 5 |
• | QC1DB |
MEAN |
5.34195 |
|
VAL | 5.,5.9 |
78 |
ron12 |
this |
last_yr |
all
|
RON12 for DIT=5.0sec and DoubleCorrLowBias |
| 6 |
• | QC1DB |
MEAN |
5.34493 |
ADU |
VAL | 5.,5.9 |
78 |
ron23 |
this |
last_yr |
all
|
RON23 for DIT=5.0sec and DoubleCorrLowBias |
| 7 |
• | QC1DB |
MEAN |
50.0167 |
ADU |
none | |
78 |
qc_darkmed |
this |
last_yr |
all
|
dark current for DIT=5.0sec and DoubleCorrLowBias |
| 8 |
• | QC1DB |
MEAN |
0.145133 |
|
VAL | 0,0.5 |
78 |
qc_dark_stdev |
this |
last_yr |
all
|
raw framedark RMS for DIT=5.0sec and DoubleCorrLowBias |
| |
|
*Data sources: QC1DB: QC1 database; LOCAL: local text file
|
| Plot 1 | | data source: | isaac_dark
(QC1 database) |
| dataset: | ron12 | • |
| mean: | 5.35801 | |
| fixed thresholds: | 5...5.9 | |
| N_data plotted: | 81 |
| [click on plot for closeup] |
| Plot 2 | | data source: | isaac_dark
(QC1 database) |
| dataset: | ron23 | • |
| mean: | 5.3721 | |
| fixed thresholds: | 5...5.9 | |
| N_data plotted: | 81 |
| [click on plot for closeup] |
| Plot 3 | | data source: | isaac_dark
(QC1 database) |
| dataset: | qc_darkmed | • |
| mean: | 47.3897 | ADU |
| thresholds: | none | |
| N_data plotted: | 81 |
| [click on plot for closeup] |
| Plot 4 | | data source: | isaac_dark
(QC1 database) |
| dataset: | qc_dark_stdev | • |
| mean: | 0.275853 | |
| fixed thresholds: | 0...0.5 | |
| N_data plotted: | 81 |
| [click on plot for closeup] |
| Plot 5 | | data source: | isaac_dark
(QC1 database) |
| dataset: | ron12 | • |
| mean: | 5.34195 | |
| fixed thresholds: | 5...5.9 | |
| N_data plotted: | 78 |
| [click on plot for closeup] |
| Plot 6 | | data source: | isaac_dark
(QC1 database) |
| dataset: | ron23 | • |
| mean: | 5.34493 | ADU |
| fixed thresholds: | 5...5.9 | ADU |
| N_data plotted: | 78 |
| [click on plot for closeup] |
| Plot 7 | | data source: | isaac_dark
(QC1 database) |
| dataset: | qc_darkmed | • |
| mean: | 50.0167 | ADU |
| thresholds: | none | |
| N_data plotted: | 78 |
| [click on plot for closeup] |
| Plot 8 | | data source: | isaac_dark
(QC1 database) |
| dataset: | qc_dark_stdev | • |
| mean: | 0.145133 | |
| fixed thresholds: | 0...0.5 | |
| N_data plotted: | 78 |
| [click on plot for closeup] |
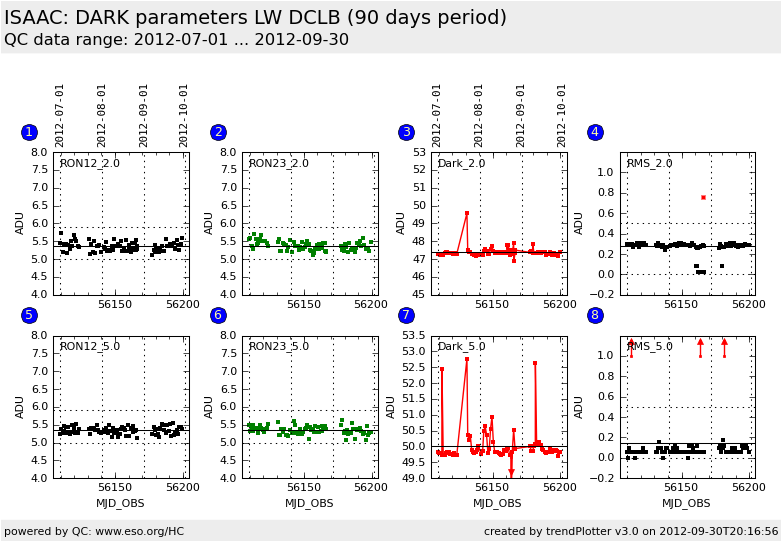
This is the trending plot for the ISAAC Aladdin
QC parameters derived from DARK frames for read mode DoubleCorrLowBias
and two DIT DIT=2sec and DIT=5sec
These plots describe:
1. RON12 for DIT=2sec,
2. RON23 for DIT=2sec,
3. Dark current for DIT=2sec,
4. RMS for DIT=5sec
5. as Fig.1 but for DIT=5sec
6. as Fig.2 but for DIT=5sec
7. as Fig.3 but for DIT=5sec
8. as Fig.4 but for DIT=5sec
RON is derived twice, once from the the first pair of raw frames (RON12 = black points),
and once from the second pair of raw frames (RON23 = green points).
DoubleCorr detector read modes (= ResetReadRead) show no significant difference between RON12 and RON23.
The dark is the median of the MASTER_DARK product.
The RMS is the standard deviation derived from the three raw frame median
values and is a measure of the short-term dark stability fir the given
DIT.
Find more information about ISAAC DARK frames
here.
Other QC parameters related to detector properties
(like
structural noise,
linearity)
are trended.
General information
Click on any of the plots to see a close-up version.
The latest date is indicated on top of the plot, data points belonging to that date are specially marked.
If configured,
- statistical averages are indicated by a solid line, and thresholds by broken lines
- outliers are marked by a red asterisk. They are defined as data points outside the
threshold lines
- "aliens" (= data points outside the plot Y limits) are marked by a red arrow (↑ or ↓)
- you can download the data for each parameter set if the 'Data downloads' link shows up
|
