Plot
? |
Symb
? |
Source
* |
Average ? |
Thresholds ? |
N_
data |
QC1
parameter |
Data
downloads |
Remarks |
| method |
value |
unit |
method |
value |
| 2 |
• | QC1DB |
MEDIAN |
2.23236 |
ADU |
VAL | 1.5,3 |
80 |
qc_UR_ron12 |
this |
last_yr |
all
|
RON in upper left (UL) quadrant (cleaned RMS) |
| 3 |
• | QC1DB |
MEDIAN |
2.30161 |
ADU |
VAL | 1.5,3 |
80 |
qc_UL_ron12 |
this |
last_yr |
all
|
like Fig.2, upper right (UR) quadrant |
| 1 |
• | QC1DB |
MEDIAN |
167.29333 |
ADU |
none | |
80 |
qc_darkmed |
this |
last_yr |
all
|
dark |
| 5 |
• | QC1DB |
MEDIAN |
2.06501 |
ADU |
VAL | 1.5,3 |
80 |
qc_LL_ron12 |
this |
last_yr |
all
|
like Fig.2, lower left (LL) quadrant |
| 6 |
• | QC1DB |
MEDIAN |
2.14162 |
ADU |
VAL | 1.5,3 |
80 |
qc_LR_ron12 |
this |
last_yr |
all
|
like Fig.2, lower right (LR) quadrant |
| 4 |
• | QC1DB |
MEDIAN |
0.25515 |
ADU |
none | |
80 |
qc_dark_stdev |
this |
last_yr |
all
|
dark RMS |
| |
|
*Data sources: QC1DB: QC1 database; LOCAL: local text file
|
| Plot 2 | | data source: | isaac_dark
(QC1 database) |
| dataset: | qc_UR_ron12 | • |
| median: | 2.23236 | ADU |
| fixed thresholds: | 1.5...3.0 | ADU |
| N_data plotted: | 80 |
| [click on plot for closeup] |
| Plot 3 | | data source: | isaac_dark
(QC1 database) |
| dataset: | qc_UL_ron12 | • |
| median: | 2.30161 | ADU |
| fixed thresholds: | 1.5...3.0 | ADU |
| N_data plotted: | 80 |
| [click on plot for closeup] |
| Plot 1 | | data source: | isaac_dark
(QC1 database) |
| dataset: | qc_darkmed | • |
| median: | 167.29333 | ADU |
| thresholds: | none | |
| N_data plotted: | 80 |
| [click on plot for closeup] |
| Plot 5 | | data source: | isaac_dark
(QC1 database) |
| dataset: | qc_LL_ron12 | • |
| median: | 2.06501 | ADU |
| fixed thresholds: | 1.5...3.0 | ADU |
| N_data plotted: | 80 |
| [click on plot for closeup] |
| Plot 6 | | data source: | isaac_dark
(QC1 database) |
| dataset: | qc_LR_ron12 | • |
| median: | 2.14162 | ADU |
| fixed thresholds: | 1.5...3.0 | ADU |
| N_data plotted: | 80 |
| [click on plot for closeup] |
| Plot 4 | | data source: | isaac_dark
(QC1 database) |
| dataset: | qc_dark_stdev | • |
| median: | 0.25515 | ADU |
| thresholds: | none | |
| N_data plotted: | 80 |
| [click on plot for closeup] |
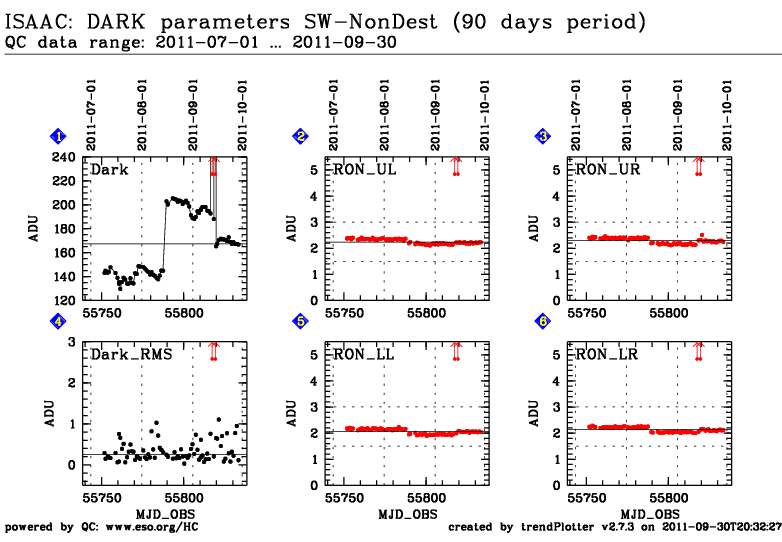
This is the trending plot for the ISAAC
QC parameters derived from DARK frames.
The setting is
OCS.SELECT-ARM=SW (Hawaii array)
DET_MODE_NAME=NonDest (used for spectroscopy) and
DET_DIT=10sec.
These plots describe:
Fig. 1. dark current, median of the MASTER_DARK frame.
Fig. 2. RON in upper left (UL) detector quadrant. It is a clean RMS derived from
the difference of the first two raw dark frames,
Fig. 3. RON As Fig.2 for upper right quadrant (UR),
Fig. 4. rms of raw dark medians,
Fig. 5. RON As Fig.2 for lower left (LL) quadrant,
Fig. 6. RON As Fig.2 for lower right (LR) quadrant.
Find more information about ISAAC DARK frames
here.
Other QC parameters related to detector properties
(like
structural noise,
linearity)
are trended.
General information
Click on any of the plots to see a close-up version.
The latest date is indicated on top of the plot, data points belonging to that date are specially marked.
If configured,
- statistical averages are indicated by a solid line, and thresholds by broken lines
- outliers are marked by a red asterisk. They are defined as data points outside the
threshold lines
- "aliens" (= data points outside the plot Y limits) are marked by a red arrow (↑ or ↓)
- you can download the data for each parameter set if the 'Data downloads' link shows up
|
