Plot
? |
Symb
? |
Source
* |
Average ? |
Thresholds ? |
N_
data |
QC1
parameter |
Data
downloads |
Remarks |
| method |
value |
unit |
method |
value |
| 1 |
• | QC1DB |
none |
|
ADU |
none | |
75 |
qc_UL_fpn |
this |
last_yr |
all
|
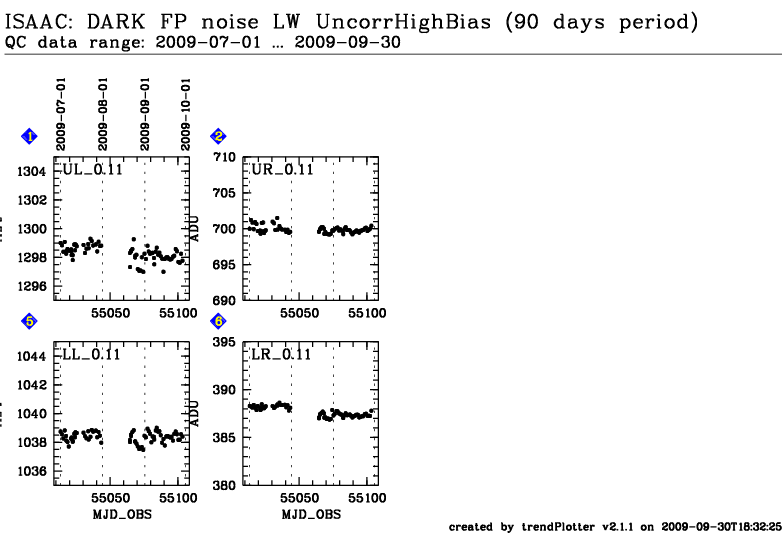
structural (fixed pattern) noise for UncorrHighBias DIT=0.11 in upper left (UL) quadrant. |
| 2 |
• | QC1DB |
none |
|
ADU |
none | |
75 |
qc_UR_fpn |
this |
last_yr |
all
|
like Fig.1, upper right (UR) quadrant, DIT=0.11 |
| 5 |
• | QC1DB |
none |
|
ADU |
none | |
75 |
qc_LL_fpn |
this |
last_yr |
all
|
like Fig.1, lower left (LL) quadrant, DIT=0.11 |
| 6 |
• | QC1DB |
none |
|
ADU |
none | |
75 |
qc_LR_fpn |
this |
last_yr |
all
|
like Fig.1, lower right (LR) quadrant, DIT=0.11 |
| |
|
*Data sources: QC1DB: QC1 database; LOCAL: local text file
|
This plot
This is the trending plot for the ISAAC
Aladdin structural noise (fixed pattern noise)
QC parameters derived from DARK frames.
QC parameter are derived from post-pipeline
Quality Control processes in Garching, hence there are no
values from Paranal to be included.
Method: fit the histogram of the MASTER_DARK product
by a Gaussian and use the width.
These plots describe:
1. FPN mode = UncorrHighBias, DIT=0.11sec, quadrant = upper left (UL),
2. FPN As Fig.1, but for UR quadrant
5. FPN As Fig.1 but for LL quadrant
6. FPN As Fig.1 but for LR quadrant
Find more information about ISAAC DARK frames
here.
Other QC parameters related to detector properties
(like
read noise,
linearity)
are trended.
General information
Click on any of the plots to see a close-up version.
The latest date is indicated on top of the plot, data points belonging to that date are specially marked.
If configured,
- statistical averages are indicated by a solid line, and thresholds by broken lines
- outliers are marked by a red asterisk. They are defined as data points outside the
threshold lines
- "aliens" (= data points outside the plot Y limits) are marked by a red arrow (↑ or ↓)
- you can download the data for each parameter set if the 'Data downloads' link shows up
|
