Plot
? |
Symb
? |
Source
* |
Average ? |
Thresholds ? |
N_
data |
QC1
parameter |
Data
downloads |
Remarks |
| method |
value |
unit |
method |
value |
| 1 |
♦ | QC1DB |
MEDIAN |
-0.03167 |
ADU/pixel |
VAL | -0.1,0.1 |
39 |
qc_grad_x |
this |
last_yr |
all
|
H-band: FOV gradient in x-direction of standard star flux |
| 1 |
• | QC1DB |
MEDIAN |
-0.01642 |
ADU/pixel |
VAL | -0.1,0.1 |
48 |
qc_grad_x |
this |
last_yr |
all
|
Js-band: FOV gradient in x-direction of standard star flux |
| 1 |
o | QC1DB |
MEDIAN |
-0.02114 |
ADU/pixel |
VAL | -0.1,0.1 |
38 |
qc_grad_x |
this |
last_yr |
all
|
J-band: FOV gradient in x-direction of standard star flux |
| 1 |
[19] | QC1DB |
MEDIAN |
-0.02685 |
ADU/pixel |
VAL | -0.1,0.1 |
50 |
qc_grad_x |
this |
last_yr |
all
|
Ks-band: FOV gradient in x-direction of standard star flux |
| 2 |
♦ | QC1DB |
MEDIAN |
-0.02598 |
ADU/pixel |
VAL | -0.1,0.1 |
39 |
qc_grad_y |
this |
last_yr |
all
|
H-band: FOV gradient in y-direction of standard star flux |
| 2 |
• | QC1DB |
MEDIAN |
-0.02554 |
ADU/pixel |
VAL | -0.1,0.1 |
48 |
qc_grad_y |
this |
last_yr |
all
|
Js-band: FOV gradient in y-direction of standard star flux |
| 2 |
o | QC1DB |
MEDIAN |
-0.01735 |
ADU/pixel |
VAL | -0.1,0.1 |
38 |
qc_grad_y |
this |
last_yr |
all
|
J-band: FOV gradient in y-direction of standard star flux |
| 2 |
[19] | QC1DB |
MEDIAN |
-0.02288 |
ADU/pixel |
VAL | -0.1,0.1 |
50 |
qc_grad_y |
this |
last_yr |
all
|
Ks-band: FOV gradient in y-direction of standard star flux |
| 3 |
♦ | QC1DB |
MEDIAN |
0.02369 |
ADU/pixel |
VAL | 0,0.075 |
39 |
qc_grad_dx |
this |
last_yr |
all
|
H-band: RMS in x-gradient |
| 3 |
• | QC1DB |
MEDIAN |
0.02666 |
ADU/pixel |
VAL | 0,0.075 |
48 |
qc_grad_dx |
this |
last_yr |
all
|
Js-band: RMS in x-gradient |
| 3 |
o | QC1DB |
MEDIAN |
0.01855 |
ADU/pixel |
VAL | 0,0.075 |
38 |
qc_grad_dx |
this |
last_yr |
all
|
J-band: RMS in x-gradient |
| 3 |
[19] | QC1DB |
MEDIAN |
0.02985 |
ADU/pixel |
VAL | 0,0.075 |
50 |
qc_grad_dx |
this |
last_yr |
all
|
Ks-band: RMS in x-gradient |
| 4 |
♦ | QC1DB |
MEDIAN |
0.02934 |
ADU/pixel |
VAL | 0,0.075 |
39 |
qc_grad_dy |
this |
last_yr |
all
|
H-band: RMS of y-gradient |
| 4 |
• | QC1DB |
MEDIAN |
0.0197 |
ADU/pixel |
VAL | 0,0.075 |
48 |
qc_grad_dy |
this |
last_yr |
all
|
Js-band: RMS of y-gradient |
| 4 |
o | QC1DB |
MEDIAN |
0.02007 |
ADU/pixel |
VAL | 0,0.075 |
38 |
qc_grad_dy |
this |
last_yr |
all
|
J-band: RMS of y-gradient |
| 4 |
[19] | QC1DB |
MEDIAN |
0.02871 |
ADU/pixel |
VAL | 0,0.075 |
50 |
qc_grad_dy |
this |
last_yr |
all
|
Ks-band: RMS of y-gradient |
| |
|
*Data sources: QC1DB: QC1 database; LOCAL: local text file
|
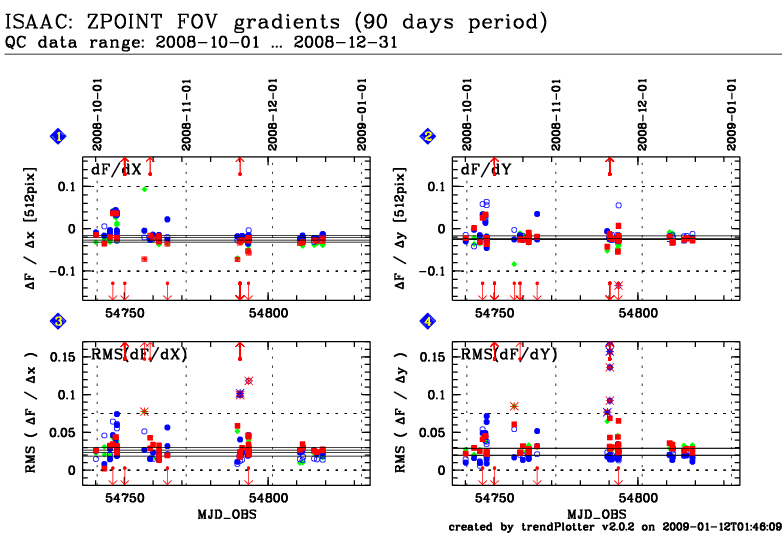
This plot
This is the trending plot for the ISAAC
QC parameters derived from photometric zeropoint frames.
These plots describe:
1. The spatial gradient of the photometric zeropoint along the x-axis.
2. The spatial gradient of the photometric zeropoint along the y-axis.
3. The RMS of the gradient in x derived from the linear regression analysis
4. The RMS of the gradient in y derived from the linear regression analysis
The FOV gradients are derived from the five single raw frame exposures.
Since the five measurements are acquired at five different positions on the
detector, a simple spatial photometry can be derived for reasons of health
check. These measurements serve as a quick look.
This QC check is complementory to the annualy acquired illumination
checks. The illumination checks puts the star on a finer grid on the
detetctor and fits a non-linear 2-dim polynomial.
Find more information about ISAAC ZPOINT calibrations
here.
Other QC parameters related to detector properties
(like
photometric zeropoints,
linearity)
are trended.
General information
Click on any of the plots to see a close-up version.
The latest date is indicated on top of the plot, data points belonging to that date are specially marked.
If configured,
- statistical averages are indicated by a solid line, and thresholds by broken lines
- outliers are marked by a red asterisk. They are defined as data points outside the
threshold lines
- "aliens" (= data points outside the plot Y limits) are marked by a red arrow (↑ or ↓)
- you can download the data for each parameter set if the 'Data downloads' link shows up
|
