Plot
? |
Symb
? |
Source
* |
Average ? |
Thresholds ? |
N_
data |
QC1
parameter |
Data
downloads |
Remarks |
| method |
value |
unit |
method |
value |
| 1 |
• | QC1DB |
none |
|
mag |
none | |
1413 |
qc_atx0 |
all (full time range)
| Measured zero-points, chip 4 |
| 1 |
• | QC1DB |
none |
|
mag |
none | |
923 |
qc_atx0 |
all (full time range)
| Measured zero-points, chip 4 |
| 2 |
• | QC1DB |
none |
|
mag |
none | |
1416 |
qc_atx0 |
all (full time range)
| Measured zero-points, chip 3 |
| 2 |
• | QC1DB |
none |
|
mag |
none | |
918 |
qc_atx0 |
all (full time range)
| Measured zero-points, chip 3 |
| 3 |
• | QC1DB |
none |
|
mag |
none | |
1493 |
qc_atx0 |
all (full time range)
| Means of the measured zero-points of the four chips |
| 3 |
• | QC1DB |
none |
|
mag |
none | |
790 |
qc_atx0 |
all (full time range)
| Means of the measured zero-points of the four chips |
| 4 |
• | QC1DB |
none |
|
mag |
none | |
1417 |
qc_atx0 |
all (full time range)
| Measured zero-points, chip 1 |
| 4 |
• | QC1DB |
none |
|
mag |
none | |
909 |
qc_atx0 |
all (full time range)
| Measured zero-points, chip 1 |
| 5 |
• | QC1DB |
none |
|
mag |
none | |
1414 |
qc_atx0 |
all (full time range)
| Measured zero-points, chip 2 |
| 5 |
• | QC1DB |
none |
|
mag |
none | |
919 |
qc_atx0 |
all (full time range)
| Measured zero-points, chip 2 |
| 6 |
• | QC1DB |
none |
|
mag |
none | |
2479 |
qc_atx0 |
all (full time range)
| Standard deviations of the measured zero-points of the four chips |
| |
|
*Data sources: QC1DB: QC1 database; LOCAL: local data source
|
| Plot 4 | | data source: | hawki_zp
(QC1 database) |
dataset:
(numbers below apply to this dataset) | qc_atx0 | • |
| average: | none |
| thresholds: | none |
| N_data plotted: | 1417 |
| (current) reference: | 25.7 |
| [click plot for closeup] |
| Plot 5 | | data source: | hawki_zp
(QC1 database) |
dataset:
(numbers below apply to this dataset) | qc_atx0 | • |
| average: | none |
| thresholds: | none |
| N_data plotted: | 1414 |
| (current) reference: | 25.7 |
| [click plot for closeup] |
| Plot 2 | | data source: | hawki_zp
(QC1 database) |
dataset:
(numbers below apply to this dataset) | qc_atx0 | • |
| average: | none |
| thresholds: | none |
| N_data plotted: | 1416 |
| (current) reference: | 25.7 |
| [click plot for closeup] |
| Plot 1 | | data source: | hawki_zp
(QC1 database) |
dataset:
(numbers below apply to this dataset) | qc_atx0 | • |
| average: | none |
| thresholds: | none |
| N_data plotted: | 1413 |
| (current) reference: | 25.7 |
| [click plot for closeup] |
| Plot 3 | | data source: | hawki_zp
(QC1 database) |
dataset:
(numbers below apply to this dataset) | qc_atx0 | • |
| average: | none |
| thresholds: | none |
| N_data plotted: | 1493 |
| (current) reference: | 25.7 |
| [click plot for closeup] |
| Plot 6 | | data source: | hawki_zp
(QC1 database) |
| dataset: | qc_atx0 | • |
| average: | none |
| thresholds: | none |
| N_data plotted: | 2479 |
| (current) reference: | undefined |
| [click plot for closeup] |
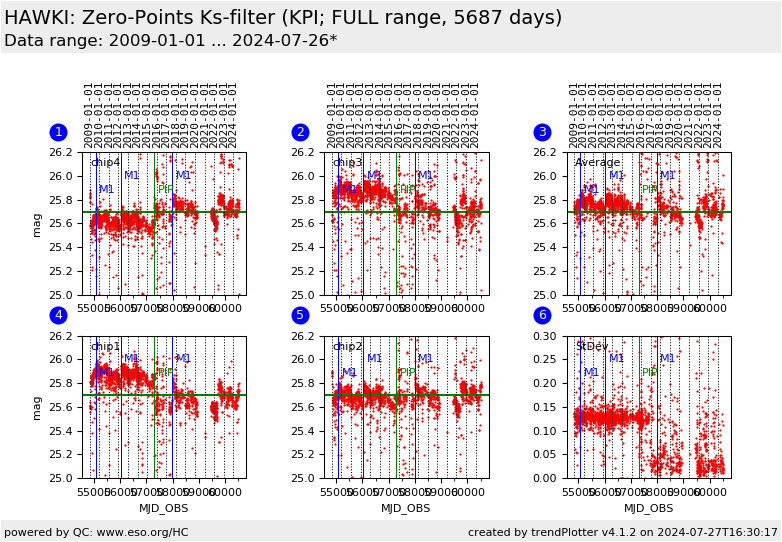
This is instrument performance plot for the extinction corrected photometric
zeropoints (at airmass X=0), derived from photometric standard
star calibration frames observed in Ks filter.
On 2016-11-19 new, CASU pipeline was adopted (green vertical
line), which uses revised method for calculating zeropoints. It takes
into accout DET.NDIT in the total observing time (DET.DITxDET.NDIT)
rather than DET.DIT as was done by the previous pipeline. To
bring the values to the same level, the CASU zeropoints are
corrected by
"+ 2.5 * log10(NDIT)" in this plot. Only data taken with DET.NDIT=5 are plotted.
The reference values for each detector are currently identical to the median of the measured values.
Fig. 1. chip4: The zeropoints for chip #4. Reference value: 25.7 mag
Fig. 2. chip3: The zeropoints for chip #3. Reference value: 25.7 mag
Fig. 3. Average: The zeropoints averaged over all detectors.
This view is sensitive to common changes. Reference value: 25.7 mag
Fig. 4. chip1: The zeropoints for chip #1. Reference value: 25.7 mag
Fig. 5. chip2: The zeropoints for chip #2. Reference value: 25.7 mag
Fig. 6. Scatter View: The standard deviation of the zeropoints, obtained from the sample of all detectors.
This view is sensitive changes of individual detectors.
Major M1 mirror recoating events are marked with a blue vertical bar.
General information
Click on any of the plots to see a close-up version.
The latest date is indicated on top of the plot.
If configured,
- data points belonging to the latest date are specially marked
- statistical averages are indicated by a solid line, and thresholds by broken lines
- outliers are marked by a red asterisk. They are defined as data points outside the
threshold lines
- "aliens" (= data points outside the plot Y limits) are marked by a red arrow (↑ or ↓)
- you can download the data for each parameter set if the 'Data downloads' link shows up
|
