Plot
? |
Symb
? |
Source
* |
Average ? |
Thresholds ? |
N_
data |
QC1
parameter |
Data
downloads |
Remarks |
| method |
value |
unit |
method |
value |
| 1 |
• | QC1DB |
none |
|
ADU |
none | |
7084 |
qc_dark_med |
all (full time range)
| median dark level, chip 4, DIT=2.0 |
| 2 |
• | QC1DB |
none |
|
ADU |
none | |
7087 |
qc_dark_med |
all (full time range)
| median dark level, chip 3, DIT=2.0 |
| 3 |
• | QC1DB |
none |
|
ADU |
none | |
5284 |
qc_dark_med |
all (full time range)
| median dark level, chip 4, DIT=300 |
| 4 |
• | QC1DB |
none |
|
ADU |
none | |
5284 |
qc_dark_med |
all (full time range)
| median dark level, chip 3, DIT=300 |
| 5 |
• | QC1DB |
none |
|
ADU |
none | |
7100 |
qc_dark_med |
all (full time range)
| median dark level, chip 1, DIT=2.0 |
| 6 |
• | QC1DB |
none |
|
ADU |
none | |
7085 |
qc_dark_med |
all (full time range)
| median dark level, chip 2, DIT=2.0 |
| 7 |
• | QC1DB |
none |
|
ADU |
none | |
5285 |
qc_dark_med |
all (full time range)
| median dark level, chip 1, DIT=300 |
| 8 |
• | QC1DB |
none |
|
ADU |
none | |
5284 |
qc_dark_med |
all (full time range)
| median dark level, chip 2, DIT=300 |
| |
|
*Data sources: QC1DB: QC1 database; LOCAL: local data source
|
| Plot 5 | | data source: | hawki_dark
(QC1 database) |
| dataset: | qc_dark_med | • |
| average: | none |
| thresholds: | none |
| N_data plotted: | 7100 |
| (current) reference: | 3.19 |
| [click plot for closeup] |
| Plot 6 | | data source: | hawki_dark
(QC1 database) |
| dataset: | qc_dark_med | • |
| average: | none |
| thresholds: | none |
| N_data plotted: | 7085 |
| (current) reference: | -0.604 |
| [click plot for closeup] |
| Plot 2 | | data source: | hawki_dark
(QC1 database) |
| dataset: | qc_dark_med | • |
| average: | none |
| thresholds: | none |
| N_data plotted: | 7087 |
| (current) reference: | -0.758 |
| [click plot for closeup] |
| Plot 1 | | data source: | hawki_dark
(QC1 database) |
| dataset: | qc_dark_med | • |
| average: | none |
| thresholds: | none |
| N_data plotted: | 7084 |
| (current) reference: | -0.275 |
| [click plot for closeup] |
| Plot 7 | | data source: | hawki_dark
(QC1 database) |
| dataset: | qc_dark_med | • |
| average: | none |
| thresholds: | none |
| N_data plotted: | 5285 |
| (current) reference: | 46.8 |
| [click plot for closeup] |
| Plot 8 | | data source: | hawki_dark
(QC1 database) |
| dataset: | qc_dark_med | • |
| average: | none |
| thresholds: | none |
| N_data plotted: | 5284 |
| (current) reference: | 31.4 |
| [click plot for closeup] |
| Plot 4 | | data source: | hawki_dark
(QC1 database) |
| dataset: | qc_dark_med | • |
| average: | none |
| thresholds: | none |
| N_data plotted: | 5284 |
| (current) reference: | 40.5 |
| [click plot for closeup] |
| Plot 3 | | data source: | hawki_dark
(QC1 database) |
| dataset: | qc_dark_med | • |
| average: | none |
| thresholds: | none |
| N_data plotted: | 5284 |
| (current) reference: | 31.6 |
| [click plot for closeup] |
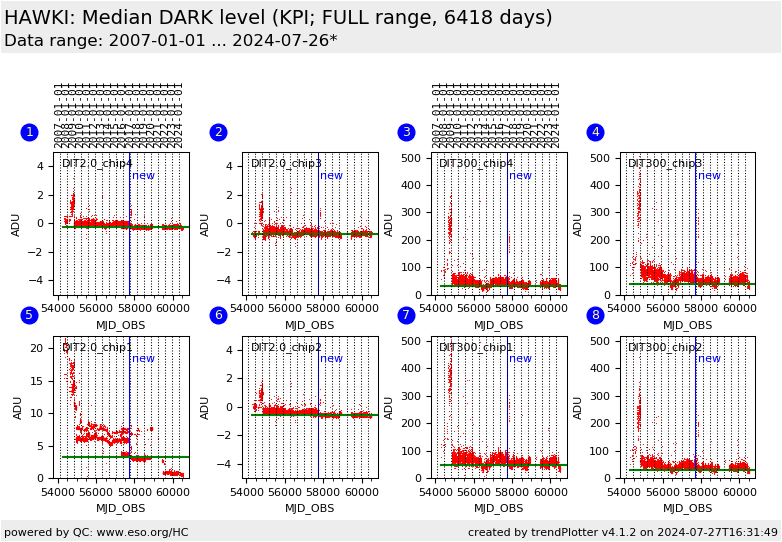
This is the instrument performance plot for the HAWKI detectors' median value across master dark.
QC parameter is derived for each detector from the raw dark
frames. Only the "NonDest" readout mode is monitored.
On 2016-11-19 (blue vertical line) new CASU pipeline was adopted.
The reference value for each detector for monitore DET.DIT=2s and
300s is currently identical to the median of the measured values.
These plots describe:
Fig. 1. chip4: The QC parameter for DIT=2.0 for chip4. Reference value: -0.275 ADU
Fig. 2. chip3: The QC parameter for DIT=2.0 for chip #3. Reference value: -0.758 ADU
Fig. 3. chip4: The QC parameter for DIT=300.0 for chip #4. Reference value: 31.6 ADU
Fig. 4. chip3: The QC parameter for DIT=300.0 for chip #3. Reference value: 40.5 ADU
Fig. 5. chip1: The QC parameter for DIT=2.0 for chip #1. Reference value: 3.19 ADU
Fig. 6. chip2: The QC parameter for DIT=2.0 for chip #2. Reference value: -0.604 ADU
Fig. 7. chip1: The QC parameter for DIT=300.0 for chip #1. Reference value: 46.8 ADU
Fig. 8. chip2: The QC parameter for DIT=300.0 for chip #2. Reference value: 31.4 ADU
General information
Click on any of the plots to see a close-up version.
The latest date is indicated on top of the plot.
If configured,
- data points belonging to the latest date are specially marked
- statistical averages are indicated by a solid line, and thresholds by broken lines
- outliers are marked by a red asterisk. They are defined as data points outside the
threshold lines
- "aliens" (= data points outside the plot Y limits) are marked by a red arrow (↑ or ↓)
- you can download the data for each parameter set if the 'Data downloads' link shows up
|
