Plot
? |
Symb
? |
Source
* |
Average ? |
Thresholds ? |
N_
data |
QC1
parameter |
Data
downloads |
Remarks |
| method |
value |
unit |
method |
value |
| 1 |
• | QC1DB |
MEDIAN |
0.41 |
ADU |
OFF | ± 0.4 |
239 |
qc_conad |
all (full time range)
| detector gain, chip 4 |
| 2 |
• | QC1DB |
MEDIAN |
0.52 |
ADU |
OFF | ± 0.4 |
240 |
qc_conad |
all (full time range)
| detector gain, chip 3 |
| 3 |
• | QC1DB |
MEDIAN |
0.477 |
ADU |
OFF | ± 0.4 |
256 |
qc_conad |
all (full time range)
| Means of the gain of the four chips |
| 4 |
• | QC1DB |
MEDIAN |
0.498 |
ADU |
OFF | ± 0.4 |
239 |
qc_conad |
all (full time range)
| detector gain, chip 1 |
| 5 |
• | QC1DB |
MEDIAN |
0.45 |
ADU |
OFF | ± 0.4 |
240 |
qc_conad |
all (full time range)
| detector gain, chip 2 |
| 6 |
• | QC1DB |
MEDIAN |
0.0613 |
ADU |
VAL | 0.0,0.3 |
256 |
qc_conad |
all (full time range)
| Standard deviations of the measured gain of the four chips |
| |
|
*Data sources: QC1DB: QC1 database; LOCAL: local data source
|
Plot 4
scores: not implemented
| | data source: | hawki_detlin
(QC1 database) |
| dataset: | qc_conad | • |
| median: | 0.498 | ADU |
| rel. thresholds: | 0.098389...0.898389 | ADU |
| N_data plotted: | 239 |
| [click plot for closeup] |
Plot 5
scores: not implemented
| | data source: | hawki_detlin
(QC1 database) |
| dataset: | qc_conad | • |
| median: | 0.45 | ADU |
| rel. thresholds: | 0.05...0.85 | ADU |
| N_data plotted: | 240 |
| [click plot for closeup] |
Plot 2
scores: not implemented
| | data source: | hawki_detlin
(QC1 database) |
| dataset: | qc_conad | • |
| median: | 0.52 | ADU |
| rel. thresholds: | 0.12...0.92 | ADU |
| N_data plotted: | 240 |
| [click plot for closeup] |
Plot 1
scores: not implemented
| | data source: | hawki_detlin
(QC1 database) |
| dataset: | qc_conad | • |
| median: | 0.41 | ADU |
| rel. thresholds: | 0.01...0.81 | ADU |
| N_data plotted: | 239 |
| [click plot for closeup] |
Plot 3
scores: not implemented
| | data source: | hawki_detlin
(QC1 database) |
| dataset: | qc_conad | • |
| median: | 0.477 | ADU |
| rel. thresholds: | 0.0775...0.8775 | ADU |
| N_data plotted: | 256 |
| [click plot for closeup] |
Plot 6
scores: not implemented
| | data source: | hawki_detlin
(QC1 database) |
| dataset: | qc_conad | • |
| median: | 0.0613 | ADU |
| fixed thresholds: | 0.0...0.3 | ADU |
| N_data plotted: | 256 |
| [click plot for closeup] |
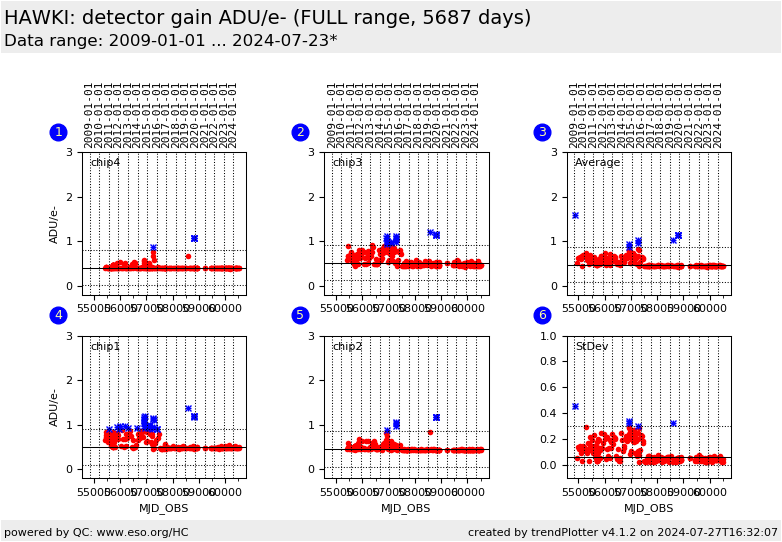
Trending report for detector gain in ADU per electrons (ADU/e-).
QC parameter is derived from each detector of the monthly acquired detector
mmoitor template.
Keep in mind, that purpose of this plot is montoring only. The
actual gain values are unreliable.
Name:
Fits header: QC.GAIN,
QC1 DB: qc_gain
Description:
Photon transfer curve analysis.
Setup:
INS.FILT1.NAME=Ks
These plots describe:
Fig. 1. chip4: The QC parameter for chip #4.
Fig. 2. chip3: The QC parameter for chip #3.
Fig. 3. Average: The QC parameter averaged over all detectors.
This view is sensitive to common changes.
Fig. 4. chip1: The QC parameter for chip #1.
Fig. 5. chip2: The QC parameter for chip #2.
Fig. 6. Scatter View: The standard deviation of the QC parameter, obtained from the sample of all detectors.
This view is sensitive changes of individual detectors.
Note that the used definition of units are (following DICD):
[GAIN] = ADU/e-
[CONAD] = e-/ADU
General information
Click on any of the plots to see a close-up version.
The latest date is indicated on top of the plot.
If configured,
- data points belonging to the latest date are specially marked
- statistical averages are indicated by a solid line, and thresholds by broken lines
- outliers are marked by a red asterisk. They are defined as data points outside the
threshold lines
- "aliens" (= data points outside the plot Y limits) are marked by a red arrow (↑ or ↓)
- you can download the data for each parameter set if the 'Data downloads' link shows up
|
