|
|
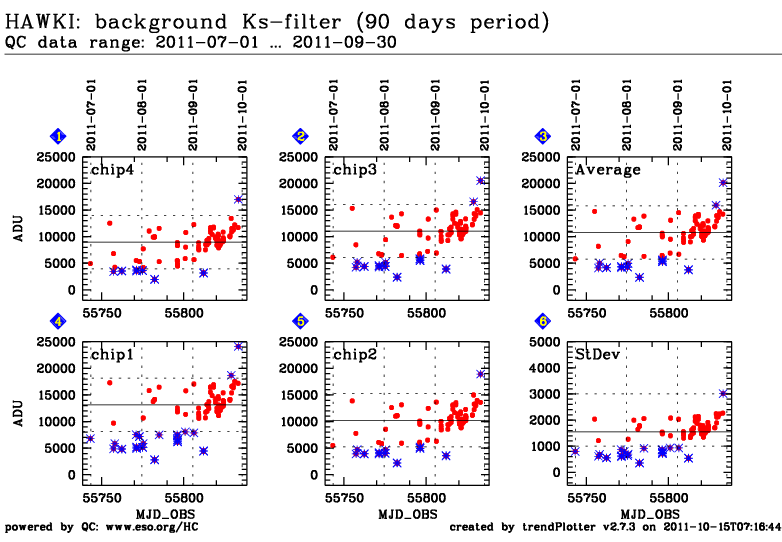
| HAWKI trending system: HISTORY plot |
|
Last update: 2011-10-15T07:17:16 (UT)
|
[an error occurred while processing this directive]
|
|
*Date on this monitor changes at 21:00 UT |
|

|
| Print: |
Information and research: |
|
- png file
|
- advanced studies:
QC1 browser |
QC1 plotter
[an error occurred while processing this directive]
|
|
Plot
? |
Symb
? |
Source
* |
Average ? |
Thresholds ? |
N_
data |
QC1
parameter |
Data
downloads |
Remarks |
| method |
value |
unit |
method |
value |
| 4 |
• | QC1DB |
MEDIAN |
13128.73633 |
ADU |
OFF | ± 5000.0 |
94 |
qc_backgd_mean |
this |
last_yr |
all
|
background, chip 1 |
| 5 |
• | QC1DB |
MEDIAN |
10230.12598 |
ADU |
OFF | ± 5000.0 |
94 |
qc_backgd_mean |
this |
last_yr |
all
|
background, chip 2 |
| 2 |
• | QC1DB |
MEDIAN |
11070.83496 |
ADU |
OFF | ± 5000.0 |
94 |
qc_backgd_mean |
this |
last_yr |
all
|
background, chip 3 |
| 1 |
• | QC1DB |
MEDIAN |
8953.49316 |
ADU |
OFF | ± 5000.0 |
94 |
qc_backgd_mean |
this |
last_yr |
all
|
background, chip 4 |
| 3 |
• | QC1DB |
MEDIAN |
10804.09961 |
ADU |
OFF | ± 5000.0 |
93 |
qc_backgd_mean |
this |
last_yr |
all
|
Means of the background of the four chips |
| 6 |
• | QC1DB |
MEDIAN |
1550.25 |
ADU |
VAL | 1000,3000 |
93 |
qc_backgd_mean |
this |
last_yr |
all
|
Standard deviations of the measured background of the four chips |
| |
|
*Data sources: QC1DB: QC1 database; LOCAL: local text file
|
| Plot 4 | | data source: | hawki_science
(QC1 database) |
| dataset: | qc_backgd_mean | • |
| median: | 13128.73633 | ADU |
| rel. thresholds: | 8128.73633...18128.73633 | ADU |
| N_data plotted: | 94 |
| [click on plot for closeup] |
| Plot 5 | | data source: | hawki_science
(QC1 database) |
| dataset: | qc_backgd_mean | • |
| median: | 10230.12598 | ADU |
| rel. thresholds: | 5230.12598...15230.12598 | ADU |
| N_data plotted: | 94 |
| [click on plot for closeup] |
| Plot 2 | | data source: | hawki_science
(QC1 database) |
| dataset: | qc_backgd_mean | • |
| median: | 11070.83496 | ADU |
| rel. thresholds: | 6070.83496...16070.83496 | ADU |
| N_data plotted: | 94 |
| [click on plot for closeup] |
| Plot 1 | | data source: | hawki_science
(QC1 database) |
| dataset: | qc_backgd_mean | • |
| median: | 8953.49316 | ADU |
| rel. thresholds: | 3953.49316...13953.49316 | ADU |
| N_data plotted: | 94 |
| [click on plot for closeup] |
| Plot 3 | | data source: | hawki_science
(QC1 database) |
| dataset: | qc_backgd_mean | • |
| median: | 10804.09961 | ADU |
| rel. thresholds: | 5804.09961...15804.09961 | ADU |
| N_data plotted: | 93 |
| [click on plot for closeup] |
| Plot 6 | | data source: | hawki_science
(QC1 database) |
| dataset: | qc_backgd_mean | • |
| median: | 1550.25 | ADU |
| fixed thresholds: | 1000.0...3000.0 | ADU |
| N_data plotted: | 93 |
| [click on plot for closeup] |
[an error occurred while processing this directive]
General information
Click on any of the plots to see a close-up version.
The latest date is indicated on top of the plot, data points belonging to that date are specially marked.
If configured,
- statistical averages are indicated by a solid line, and thresholds by broken lines
- outliers are marked by a red asterisk. They are defined as data points outside the
threshold lines
- "aliens" (= data points outside the plot Y limits) are marked by a red arrow (↑ or ↓)
- you can download the data for each parameter set if the 'Data downloads' link shows up
|