Plot
? |
Symb
? |
Source
* |
Average ? |
Thresholds ? |
N_
data |
QC1
parameter |
Data
downloads |
Remarks |
| method |
value |
unit |
method |
value |
| 5 |
• | QC1DB |
MEDIAN |
10.58993 |
ADU |
3SIG | ± 0.32262 |
149 |
qc_ron12 |
this |
last_yr |
all
|
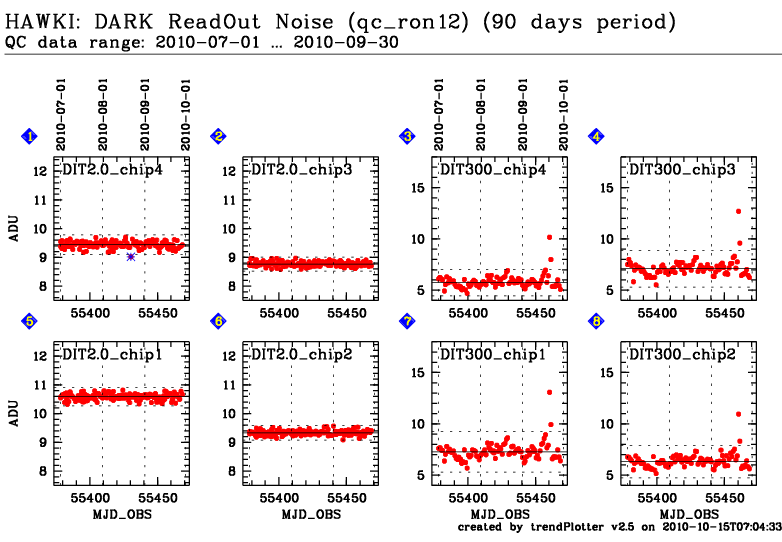
DARK ReadOut Noise from RAW1 and RAW2, chip 1, DIT=2.0 |
| 6 |
• | QC1DB |
MEDIAN |
9.327 |
ADU |
3SIG | ± 0.25088 |
149 |
qc_ron12 |
this |
last_yr |
all
|
DARK ReadOut Noise from RAW1 and RAW2, chip 2, DIT=2.0 |
| 2 |
• | QC1DB |
MEDIAN |
8.7647 |
ADU |
3SIG | ± 0.24377 |
149 |
qc_ron12 |
this |
last_yr |
all
|
DARK ReadOut Noise from RAW1 and RAW2, chip 3, DIT=2.0 |
| 1 |
• | QC1DB |
MEDIAN |
9.44368 |
ADU |
3SIG | ± 0.34242 |
149 |
qc_ron12 |
this |
last_yr |
all
|
DARK ReadOut Noise from RAW1 and RAW2, chip 4, DIT=2.0 |
| 7 |
• | QC1DB |
MEDIAN |
7.2737 |
ADU |
3SIG | ± 1.96772 |
96 |
qc_ron12 |
this |
last_yr |
all
|
DARK ReadOut Noise from RAW1 and RAW2, chip 1, DIT=300 |
| 8 |
• | QC1DB |
MEDIAN |
6.31385 |
ADU |
3SIG | ± 1.57652 |
96 |
qc_ron12 |
this |
last_yr |
all
|
DARK ReadOut Noise from RAW1 and RAW2, chip 2, DIT=300 |
| 4 |
• | QC1DB |
MEDIAN |
7.09458 |
ADU |
3SIG | ± 1.77841 |
96 |
qc_ron12 |
this |
last_yr |
all
|
DARK ReadOut Noise from RAW1 and RAW2, chip 3, DIT=300 |
| 3 |
• | QC1DB |
MEDIAN |
5.74566 |
ADU |
3SIG | ± 1.29576 |
96 |
qc_ron12 |
this |
last_yr |
all
|
DARK ReadOut Noise from RAW1 and RAW2, chip 4, DIT=300 |
| |
|
*Data sources: QC1DB: QC1 database; LOCAL: local text file
|
| Plot 5 | | data source: | hawki_dark
(QC1 database) |
| parameter | dataset: | qc_ron12 | • |
| median: | 10.58993 | ADU |
| rel. thresholds: 3σ | 10.26731...10.91255 | ADU |
| N_data: | 149 |
| [click on plot for closeup] |

| Plot 6 | | data source: | hawki_dark
(QC1 database) |
| parameter | dataset: | qc_ron12 | • |
| median: | 9.327 | ADU |
| rel. thresholds: 3σ | 9.07612...9.57788 | ADU |
| N_data: | 149 |
| [click on plot for closeup] |

| Plot 2 | | data source: | hawki_dark
(QC1 database) |
| parameter | dataset: | qc_ron12 | • |
| median: | 8.7647 | ADU |
| rel. thresholds: 3σ | 8.52094...9.00847 | ADU |
| N_data: | 149 |
| [click on plot for closeup] |

| Plot 1 | | data source: | hawki_dark
(QC1 database) |
| parameter | dataset: | qc_ron12 | • |
| median: | 9.44368 | ADU |
| rel. thresholds: 3σ | 9.10126...9.7861 | ADU |
| N_data: | 149 |
| [click on plot for closeup] |

| Plot 7 | | data source: | hawki_dark
(QC1 database) |
| parameter | dataset: | qc_ron12 | • |
| median: | 7.2737 | ADU |
| rel. thresholds: 3σ | 5.30598...9.24142 | ADU |
| N_data: | 96 |
| [click on plot for closeup] |

| Plot 8 | | data source: | hawki_dark
(QC1 database) |
| parameter | dataset: | qc_ron12 | • |
| median: | 6.31385 | ADU |
| rel. thresholds: 3σ | 4.73733...7.89038 | ADU |
| N_data: | 96 |
| [click on plot for closeup] |

| Plot 4 | | data source: | hawki_dark
(QC1 database) |
| parameter | dataset: | qc_ron12 | • |
| median: | 7.09458 | ADU |
| rel. thresholds: 3σ | 5.31618...8.87299 | ADU |
| N_data: | 96 |
| [click on plot for closeup] |

| Plot 3 | | data source: | hawki_dark
(QC1 database) |
| parameter | dataset: | qc_ron12 | • |
| median: | 5.74566 | ADU |
| rel. thresholds: 3σ | 4.4499...7.04142 | ADU |
| N_data: | 96 |
| [click on plot for closeup] |

Click on any of the plots to see a close-up version.
The latest date is indicated on top of the plot, data points belonging to that date are specially marked.
If configured,
- statistical averages are indicated by a solid line, and thresholds by broken lines
- outliers are marked by a red asterisk. They are defined as data points outside the
threshold lines
- "aliens" (= data points outside the plot Y limits) are marked by a red arrow (↑ or ↓)
- you can download the data for each parameter set if the 'Data downloads' link shows up
|
