|
C
[page auto-refreshes after 300 sec]
[press Ctrl+R to enforce refresh of scores and dates]
|
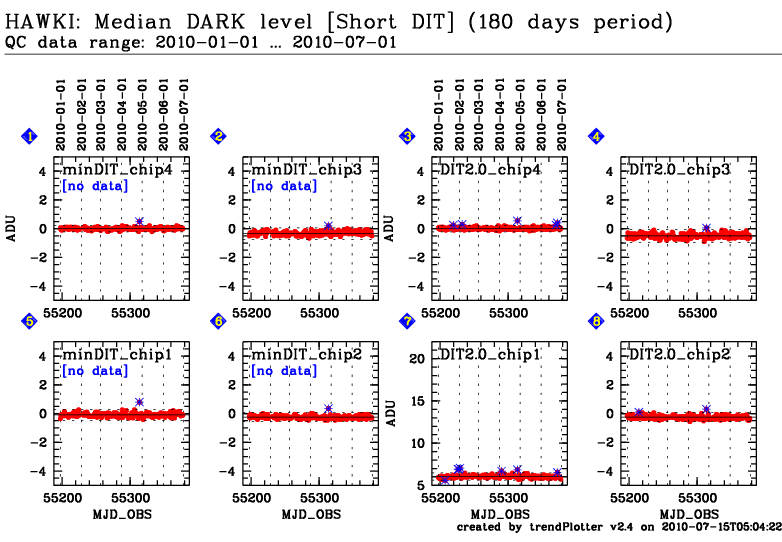
| HAWKI trending system: HISTORY plot |
|
Last update: 2010-07-15T05:05:50 (UT)
|
[an error occurred while processing this directive]
|
|
*Date on this monitor changes at 21:00 UT |
|

|
| Print: |
Information and research: |
|
- png file
|
- advanced studies:
QC1 browser |
QC1 plotter
[an error occurred while processing this directive]
|
|
Plot
? |
Symb
? |
Source
* |
Average ? |
Thresholds ? |
N_
data |
QC1
parameter |
Data
downloads |
Remarks |
| method |
value |
unit |
method |
value |
| 5 |
• | QC1DB |
MEDIAN |
|
ADU |
3SIG | ± 0.0 |
0 |
qc_dark_med |
this |
last_yr |
all
|
median dark level, chip 1, DIT=1.2572 |
| 5 |
• | QC1DB |
MEDIAN |
-0.1 |
ADU |
3SIG | ± 0.36749 |
184 |
qc_dark_med |
this |
last_yr |
all
|
median dark level, chip 1, DIT=1.6762 |
| 6 |
• | QC1DB |
MEDIAN |
|
ADU |
3SIG | ± 0.0 |
0 |
qc_dark_med |
this |
last_yr |
all
|
median dark level, chip 2, DIT=1.2572 |
| 6 |
• | QC1DB |
MEDIAN |
-0.25 |
ADU |
3SIG | ± 0.30347 |
184 |
qc_dark_med |
this |
last_yr |
all
|
median dark level, chip 2, DIT=1.6762 |
| 2 |
• | QC1DB |
MEDIAN |
|
ADU |
3SIG | ± 0.0 |
0 |
qc_dark_med |
this |
last_yr |
all
|
median dark level, chip 3, DIT=1.2572 |
| 2 |
• | QC1DB |
MEDIAN |
-0.35 |
ADU |
3SIG | ± 0.40119 |
184 |
qc_dark_med |
this |
last_yr |
all
|
median dark level, chip 3, DIT=1.6762 |
| 1 |
• | QC1DB |
MEDIAN |
|
ADU |
3SIG | ± 0.0 |
0 |
qc_dark_med |
this |
last_yr |
all
|
median dark level, chip 4, DIT=1.2572 |
| 1 |
• | QC1DB |
MEDIAN |
0.0 |
ADU |
3SIG | ± 0.2193 |
184 |
qc_dark_med |
this |
last_yr |
all
|
median dark level, chip 4, DIT=1.6762 |
| 7 |
• | QC1DB |
MEDIAN |
6.05 |
ADU |
3SIG | ± 0.42167 |
202 |
qc_dark_med |
this |
last_yr |
all
|
median dark level, chip 1, DIT=2.0 |
| 8 |
• | QC1DB |
MEDIAN |
-0.25 |
ADU |
3SIG | ± 0.32522 |
202 |
qc_dark_med |
this |
last_yr |
all
|
median dark level, chip 2, DIT=2.0 |
| 4 |
• | QC1DB |
MEDIAN |
-0.5 |
ADU |
3SIG | ± 0.45795 |
202 |
qc_dark_med |
this |
last_yr |
all
|
median dark level, chip 3, DIT=2.0 |
| 3 |
• | QC1DB |
MEDIAN |
0.0 |
ADU |
3SIG | ± 0.21635 |
202 |
qc_dark_med |
this |
last_yr |
all
|
median dark level, chip 4, DIT=2.0 |
| |
|
*Data sources: QC1DB: QC1 database; LOCAL: local text file
|
This plot
[an error occurred while processing this directive]
General information
Click on any of the plots to see a close-up version.
The latest date is indicated on top of the plot, data points belonging to that date are specially marked.
If configured,
- statistical averages are indicated by a solid line, and thresholds by broken lines
- outliers are marked by a red asterisk. They are defined as data points outside the
threshold lines
- "aliens" (= data points outside the plot Y limits) are marked by a red arrow (↑ or ↓)
- you can download the data for each parameter set if the 'Data downloads' link shows up
|
|