Plot
? |
Symb
? |
Source
* |
Average ? |
Thresholds ? |
N_
data |
QC1
parameter |
Data
downloads |
Remarks |
| method |
value |
unit |
method |
value |
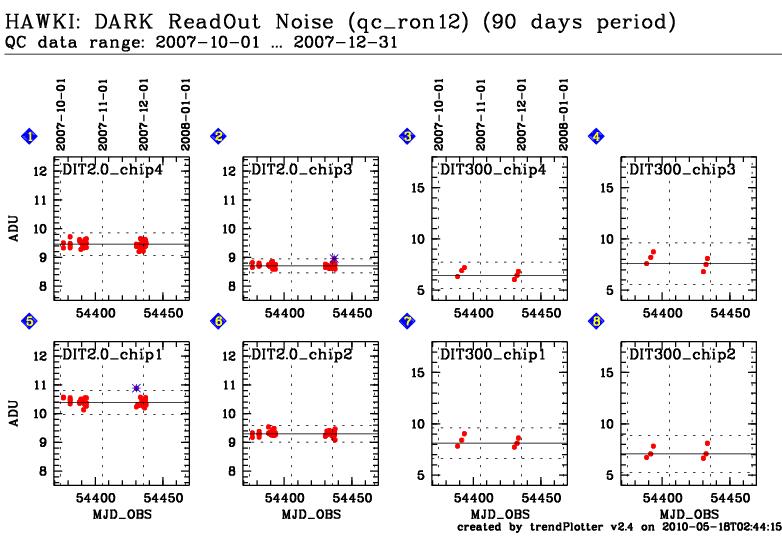
| 5 |
• | QC1DB |
MEDIAN |
10.38285 |
ADU |
3SIG | ± 0.41336 |
37 |
qc_ron12 |
this |
last_yr |
all
|
DARK ReadOut Noise from RAW1 and RAW2, chip 1, DIT=2.0 |
| 6 |
• | QC1DB |
MEDIAN |
9.2899 |
ADU |
3SIG | ± 0.2844 |
37 |
qc_ron12 |
this |
last_yr |
all
|
DARK ReadOut Noise from RAW1 and RAW2, chip 2, DIT=2.0 |
| 2 |
• | QC1DB |
MEDIAN |
8.70434 |
ADU |
3SIG | ± 0.24537 |
37 |
qc_ron12 |
this |
last_yr |
all
|
DARK ReadOut Noise from RAW1 and RAW2, chip 3, DIT=2.0 |
| 1 |
• | QC1DB |
MEDIAN |
9.45755 |
ADU |
3SIG | ± 0.39318 |
37 |
qc_ron12 |
this |
last_yr |
all
|
DARK ReadOut Noise from RAW1 and RAW2, chip 4, DIT=2.0 |
| 7 |
• | QC1DB |
MEDIAN |
8.10405 |
ADU |
3SIG | ± 1.49168 |
6 |
qc_ron12 |
this |
last_yr |
all
|
DARK ReadOut Noise from RAW1 and RAW2, chip 1, DIT=300 |
| 8 |
• | QC1DB |
MEDIAN |
7.06353 |
ADU |
3SIG | ± 1.78408 |
6 |
qc_ron12 |
this |
last_yr |
all
|
DARK ReadOut Noise from RAW1 and RAW2, chip 2, DIT=300 |
| 4 |
• | QC1DB |
MEDIAN |
7.58906 |
ADU |
3SIG | ± 2.01385 |
6 |
qc_ron12 |
this |
last_yr |
all
|
DARK ReadOut Noise from RAW1 and RAW2, chip 3, DIT=300 |
| 3 |
• | QC1DB |
MEDIAN |
6.45637 |
ADU |
3SIG | ± 1.28175 |
6 |
qc_ron12 |
this |
last_yr |
all
|
DARK ReadOut Noise from RAW1 and RAW2, chip 4, DIT=300 |
| |
|
*Data sources: QC1DB: QC1 database; LOCAL: local text file
|
General information
Click on any of the plots to see a close-up version.
The latest date is indicated on top of the plot, data points belonging to that date are specially marked.
If configured,
- statistical averages are indicated by a solid line, and thresholds by broken lines
- outliers are marked by a red asterisk. They are defined as data points outside the
threshold lines
- "aliens" (= data points outside the plot Y limits) are marked by a red arrow (↑ or ↓)
- you can download the data for each parameter set if the 'Data downloads' link shows up
|
