|
[page auto-refreshes after 60 sec]
[press Ctrl+R to enforce refresh of scores and dates]
| HAWKI trending system: HISTORY plot |
|
Last update: 2009-02-05T11:45:29 (UT)
|
|
|
|
|

|
|
|
Plot
? |
Symb
? |
Source
* |
Average ? |
Thresholds ? |
N_
data |
QC1
parameter |
Data
downloads |
Remarks |
| method |
value |
unit |
method |
value |
| 5 |
• | QC1DB |
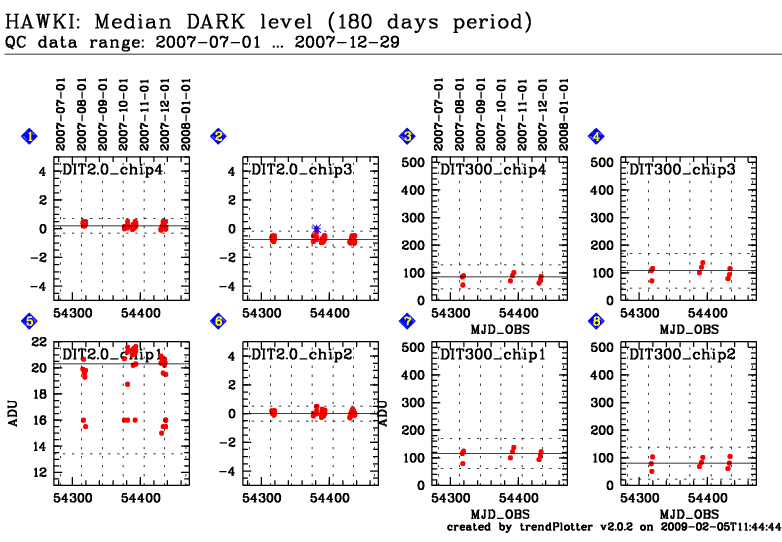
MEDIAN |
20.3 |
ADU |
3SIG | ± 6.88631 |
44 |
qc_dark_med |
this |
last_yr |
all
|
median dark level, chip 1, DIT=2.0 |
| 6 |
• | QC1DB |
MEDIAN |
0.0 |
ADU |
3SIG | ± 0.52192 |
44 |
qc_dark_med |
this |
last_yr |
all
|
median dark level, chip 2, DIT=2.0 |
| 2 |
• | QC1DB |
MEDIAN |
-0.73333 |
ADU |
3SIG | ± 0.5562 |
44 |
qc_dark_med |
this |
last_yr |
all
|
median dark level, chip 3, DIT=2.0 |
| 1 |
• | QC1DB |
MEDIAN |
0.2 |
ADU |
3SIG | ± 0.50465 |
44 |
qc_dark_med |
this |
last_yr |
all
|
median dark level, chip 4, DIT=2.0 |
| 7 |
• | QC1DB |
MEDIAN |
115.39979 |
ADU |
3SIG | ± 54.66145 |
9 |
qc_dark_med |
this |
last_yr |
all
|
median dark level, chip 1, DIT=300 |
| 8 |
• | QC1DB |
MEDIAN |
80.61998 |
ADU |
3SIG | ± 57.80595 |
9 |
qc_dark_med |
this |
last_yr |
all
|
median dark level, chip 2, DIT=300 |
| 4 |
• | QC1DB |
MEDIAN |
108.10335 |
ADU |
3SIG | ± 62.81073 |
9 |
qc_dark_med |
this |
last_yr |
all
|
median dark level, chip 3, DIT=300 |
| 3 |
• | QC1DB |
MEDIAN |
85.9203 |
ADU |
3SIG | ± 43.56257 |
9 |
qc_dark_med |
this |
last_yr |
all
|
median dark level, chip 4, DIT=300 |
| |
|
*Data sources: QC1DB: QC1 database; LOCAL: local text file
|
General information
Click on any of the plots to see a close-up version.
The latest date is indicated on top of the plot, data points belonging to that date are specially marked.
If configured,
- statistical averages are indicated by a solid line, and thresholds by broken lines
- outliers are marked by a red asterisk. They are defined as data points outside the
threshold lines
- "aliens" (= data points outside the plot Y limits) are marked by a red arrow (↑ or ↓)
- you can download the data for each parameter set if the 'Data downloads' link shows up
|
|