Plot
? |
Symb
? |
Source
* |
Average ? |
Thresholds ? |
N_
data |
QC1
parameter |
Data
downloads |
Remarks |
| method |
value |
unit |
method |
value |
| 1 |
• | QC1DB |
MEDIAN |
40.7 |
nm |
VAL | 0,100 |
4 |
metfit_rms_sc |
this |
last_yr |
all
|
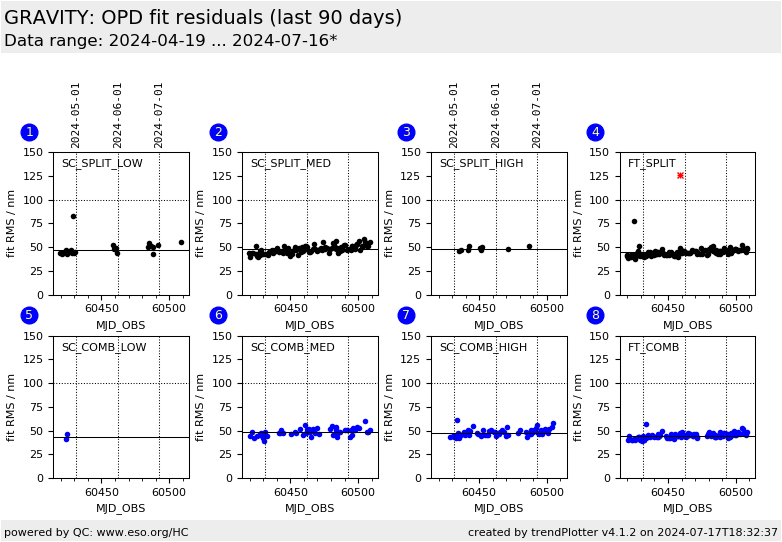
RMS of fit to metrology, Science Camera (SC) detector, SPLIT polarisation, low resolution |
| 2 |
• | QC1DB |
MEDIAN |
38.8 |
nm |
VAL | 0,100 |
96 |
metfit_rms_sc |
this |
last_yr |
all
|
RMS of fit to metrology, Science Camera (SC) detector, SPLIT polarisation, medium resolution |
| 3 |
• | QC1DB |
MEDIAN |
40.3 |
nm |
VAL | 0,100 |
39 |
metfit_rms_sc |
this |
last_yr |
all
|
RMS of fit to metrology, Science Camera (SC) detector, SPLIT polarisation, high resolution |
| 4 |
• | QC1DB |
MEDIAN |
37.9 |
nm |
VAL | 0,100 |
139 |
metfit_rms_ft |
this |
last_yr |
all
|
RMS of fit to metrology, Fringe Tracker (FT) detector, SPLIT polarisation |
| 5 |
• | QC1DB |
MEDIAN |
40.4 |
nm |
VAL | 0,100 |
11 |
metfit_rms_sc |
this |
last_yr |
all
|
RMS of fit to metrology, Science Camera (SC) detector, COMBINED polarisation, low resolution |
| 6 |
• | QC1DB |
MEDIAN |
39.4 |
nm |
VAL | 0,100 |
81 |
metfit_rms_sc |
this |
last_yr |
all
|
RMS of fit to metrology, Science Camera (SC) detector, COMBINED polarisation, medium resolution |
| 7 |
• | QC1DB |
MEDIAN |
38.3 |
nm |
VAL | 0,100 |
59 |
metfit_rms_sc |
this |
last_yr |
all
|
RMS of fit to metrology, Science Camera (SC) detector, COMBINED polarisation, high resolution |
| 8 |
• | QC1DB |
MEDIAN |
37.9 |
nm |
VAL | 0,100 |
151 |
metfit_rms_ft |
this |
last_yr |
all
|
RMS of fit to metrology, Fringe Tracker (FT) detector, COMBINED polarisation |
| |
|
*Data sources: QC1DB: QC1 database; LOCAL: local data source
|
Plot 1
scores:  1| 1|
| | data source: | gravity_p2vm
(QC1 database) |
| dataset: | metfit_rms_sc | • |
| median: | 40.7 | nm |
| fixed thresholds: | 0...100 | nm |
| N_data plotted: | 4 |
| [click plot for closeup] |
Plot 2
scores: 8|
| | data source: | gravity_p2vm
(QC1 database) |
| dataset: | metfit_rms_sc | • |
| median: | 38.8 | nm |
| fixed thresholds: | 0...100 | nm |
| N_data plotted: | 96 |
| [click plot for closeup] |
Plot 3
scores: 7|

| | data source: | gravity_p2vm
(QC1 database) |
| dataset: | metfit_rms_sc | • |
| median: | 40.3 | nm |
| fixed thresholds: | 0...100 | nm |
| N_data plotted: | 39 |
| [click plot for closeup] |
Plot 4
scores: 11|
| | data source: | gravity_p2vm
(QC1 database) |
| dataset: | metfit_rms_ft | • |
| median: | 37.9 | nm |
| fixed thresholds: | 0...100 | nm |
| N_data plotted: | 139 |
| [click plot for closeup] |
Plot 5
scores: 1|
| | data source: | gravity_p2vm
(QC1 database) |
| dataset: | metfit_rms_sc | • |
| median: | 40.4 | nm |
| fixed thresholds: | 0...100 | nm |
| N_data plotted: | 11 |
| [click plot for closeup] |
Plot 6
scores: 5|
| | data source: | gravity_p2vm
(QC1 database) |
| dataset: | metfit_rms_sc | • |
| median: | 39.4 | nm |
| fixed thresholds: | 0...100 | nm |
| N_data plotted: | 81 |
| [click plot for closeup] |
Plot 7
scores: 8|
| | data source: | gravity_p2vm
(QC1 database) |
| dataset: | metfit_rms_sc | • |
| median: | 38.3 | nm |
| fixed thresholds: | 0...100 | nm |
| N_data plotted: | 59 |
| [click plot for closeup] |
Plot 8
scores: 14|
| | data source: | gravity_p2vm
(QC1 database) |
| dataset: | metfit_rms_ft | • |
| median: | 37.9 | nm |
| fixed thresholds: | 0...100 | nm |
| N_data plotted: | 151 |
| [click plot for closeup] |
Residuals of the fit between metrology, phase observed on the science camera, and phase observed on the fringe tracker:
a * SC + b * FT + c = MET.
The sum of these three OPDs should be constant. If it is not the case, the fit will show high residuals.
It means that one of the three OPD quantities is not well measured: either not enough flux, bad alignment of the spectra,
or unreliable metrology. The P2VM should then not be used for calibration. Repeated occurrences indicate an issue with the instrument.
General information
Click on any of the plots to see a close-up version.
The latest date is indicated on top of the plot.
If configured,
- data points belonging to the latest date are specially marked
- statistical averages are indicated by a solid line, and thresholds by broken lines
- outliers are marked by a red asterisk. They are defined as data points outside the
threshold lines
- "aliens" (= data points outside the plot Y limits) are marked by a red arrow (↑ or ↓)
- you can download the data for each parameter set if the 'Data downloads' link shows up
|
