GRAVITY trending system: HEALTH CHECK report
Last update: 2017-04-06T12:16:49 (UT)
[enable javascript for displaying time difference!]
General news:
NOTE: The Health Check and calChecker services are moved to qcFlow on an instrument by instrument basis. The current pages will not be updated any longer once the move has been finished.
GRAVITY news:
Report news:
Plot? Symb? Source Average ? Thresholds ? N_ QC1 Data Remarks
method value unit method value
1
• QC1DB MEDIAN 0.974 none none 66 tf_visamp_ft12_p1
this |
last_yr |
all
visamp, base line 12, HIGH resolution, FT
2
• QC1DB MEDIAN 0.822 none none 66 tf_visamp_ft13_p1
this |
last_yr |
all
visamp, base line 13, HIGH resolution, FT
3
• QC1DB MEDIAN 0.698 none none 66 tf_visamp_ft14_p1
this |
last_yr |
all
visamp, base line 14, HIGH resolution, FT
4
• QC1DB MEDIAN 0.819 none none 66 tf_visamp_ft23_p1
this |
last_yr |
all
visamp, base line 23, HIGH resolution, FT
5
• QC1DB MEDIAN 0.693 none none 66 tf_visamp_ft24_p1
this |
last_yr |
all
visamp, base line 24, HIGH resolution, FT
6
• QC1DB MEDIAN 0.957 none none 66 tf_visamp_ft34_p1
this |
last_yr |
all
visamp, base line 34, HIGH resolution, FT
7
• QC1DB MEDIAN 0.969 none none 66 tf_visamp_sc12_p1
this |
last_yr |
all
visamp, base line 12, HIGH resolution, SC
8
• QC1DB MEDIAN 0.899 none none 66 tf_visamp_sc13_p1
this |
last_yr |
all
visamp, base line 13, HIGH resolution, SC
9
• QC1DB MEDIAN 0.846 none none 66 tf_visamp_sc14_p1
this |
last_yr |
all
visamp, base line 14, HIGH resolution, SC
10
• QC1DB MEDIAN 0.939 none none 66 tf_visamp_sc23_p1
this |
last_yr |
all
visamp, base line 23, HIGH resolution, SC
11
• QC1DB MEDIAN 0.894 none none 66 tf_visamp_sc24_p1
this |
last_yr |
all
visamp, base line 24, HIGH resolution, SC
12
• QC1DB MEDIAN 0.956 none none 66 tf_visamp_sc34_p1
this |
last_yr |
all
visamp, base line 34, HIGH resolution, SC
*Data sources: QC1DB: QC1 database; LOCAL: local data source
Plot 1 scores: not implemented
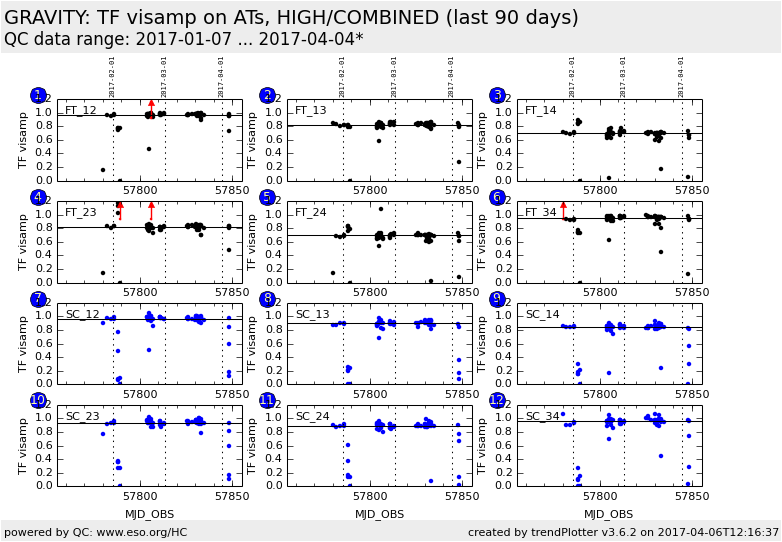
data source: gravity_vis dataset: tf_visamp_ft12_p1 • median: 0.974 none thresholds: none N_data plotted: 66 [click on plot for closeup]
Plot 2 scores: not implemented
data source: gravity_vis dataset: tf_visamp_ft13_p1 • median: 0.822 none thresholds: none N_data plotted: 66 [click on plot for closeup]
Plot 3 scores: not implemented
data source: gravity_vis dataset: tf_visamp_ft14_p1 • median: 0.698 none thresholds: none N_data plotted: 66 [click on plot for closeup]
Plot 4 scores: not implemented
data source: gravity_vis dataset: tf_visamp_ft23_p1 • median: 0.819 none thresholds: none N_data plotted: 66 [click on plot for closeup]
Plot 5 scores: not implemented
data source: gravity_vis dataset: tf_visamp_ft24_p1 • median: 0.693 none thresholds: none N_data plotted: 66 [click on plot for closeup]
Plot 6 scores: not implemented
data source: gravity_vis dataset: tf_visamp_ft34_p1 • median: 0.957 none thresholds: none N_data plotted: 66 [click on plot for closeup]
Plot 7 scores: not implemented
data source: gravity_vis dataset: tf_visamp_sc12_p1 • median: 0.969 none thresholds: none N_data plotted: 66 [click on plot for closeup]
Plot 8 scores: not implemented
data source: gravity_vis dataset: tf_visamp_sc13_p1 • median: 0.899 none thresholds: none N_data plotted: 66 [click on plot for closeup]
Plot 9 scores: not implemented
data source: gravity_vis dataset: tf_visamp_sc14_p1 • median: 0.846 none thresholds: none N_data plotted: 66 [click on plot for closeup]
Plot 10 scores: not implemented
data source: gravity_vis dataset: tf_visamp_sc23_p1 • median: 0.939 none thresholds: none N_data plotted: 66 [click on plot for closeup]
Plot 11 scores: not implemented
data source: gravity_vis dataset: tf_visamp_sc24_p1 • median: 0.894 none thresholds: none N_data plotted: 66 [click on plot for closeup]
Plot 12 scores: not implemented
data source: gravity_vis dataset: tf_visamp_sc34_p1 • median: 0.956 none thresholds: none N_data plotted: 66 [click on plot for closeup]
This plot
Transfer function visibility amplitudes per baseline from night-time calibrator measurements.
General information
Click on any of the plots to see a close-up version .
The latest date is indicated on top of the plot.
If configured,
data points belonging to the latest date are specially marked statistical averages are indicated by a solid line, and thresholds by broken lines outliers are marked by a red asterisk. They are defined as data points outside the
threshold lines "aliens" (= data points outside the plot Y limits) are marked by a red arrow (↑ ↓ you can download the data for each parameter set if the 'Data downloads' link shows up
