Plot
? |
Symb
? |
Source
* |
Average ? |
Thresholds ? |
N_
data |
QC1
parameter |
Data
downloads |
Remarks |
| method |
value |
unit |
method |
value |
| 1 |
• | QC1DB |
MEDIAN |
1.38e+03 |
counts/sec |
none | |
93 |
flux |
this |
last_yr |
all
|
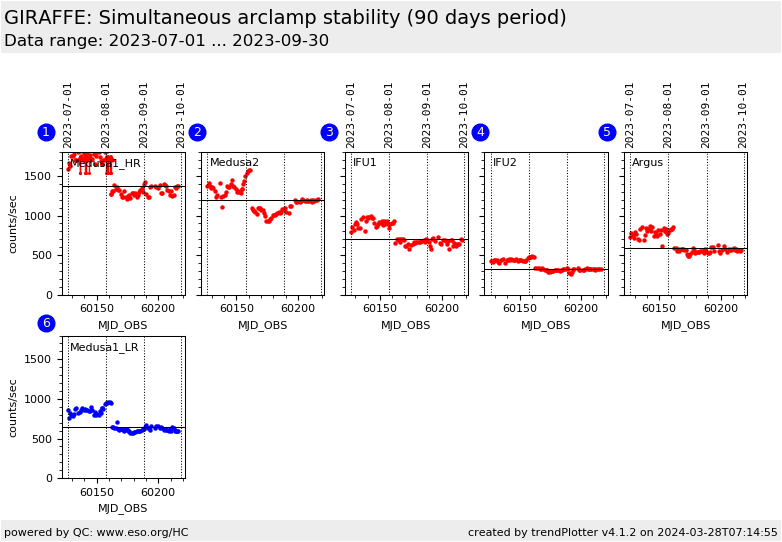
flux of SIMCAL lamp, Medusa1 HR (based on H525.8B HC data) |
| 2 |
• | QC1DB |
MEDIAN |
1.19e+03 |
counts/sec |
none | |
87 |
flux |
this |
last_yr |
all
|
as plot 1, Medusa2 |
| 3 |
• | QC1DB |
MEDIAN |
700 |
counts/sec |
none | |
87 |
flux |
this |
last_yr |
all
|
as plot 1, IFU1 |
| 4 |
• | QC1DB |
MEDIAN |
330 |
counts/sec |
none | |
84 |
flux |
this |
last_yr |
all
|
as plot 1, IFU2 |
| 5 |
• | QC1DB |
MEDIAN |
587 |
counts/sec |
none | |
87 |
flux |
this |
last_yr |
all
|
as plot 1, Argus |
|
| 6 |
• | QC1DB |
MEDIAN |
645 |
counts/sec |
none | |
88 |
flux |
this |
last_yr |
all
|
flux of SIMCAL lamp, Medusa1 LR (based on L543.1 HC data) |
| |
|
*Data sources: QC1DB: QC1 database; LOCAL: local data source
|
| Plot 1 | | data source: | giraffe_simlamp
(QC1 database) |
| dataset: | flux | • |
| median: | 1.38e+03 | counts/sec |
| thresholds: | none | |
| N_data plotted: | 93 |
| [click plot for closeup] |
| Plot 2 | | data source: | giraffe_simlamp
(QC1 database) |
| dataset: | flux | • |
| median: | 1.19e+03 | counts/sec |
| thresholds: | none | |
| N_data plotted: | 87 |
| [click plot for closeup] |
| Plot 3 | | data source: | giraffe_simlamp
(QC1 database) |
| dataset: | flux | • |
| median: | 700 | counts/sec |
| thresholds: | none | |
| N_data plotted: | 87 |
| [click plot for closeup] |
| Plot 4 | | data source: | giraffe_simlamp
(QC1 database) |
| dataset: | flux | • |
| median: | 330 | counts/sec |
| thresholds: | none | |
| N_data plotted: | 84 |
| [click plot for closeup] |
| Plot 5 | | data source: | giraffe_simlamp
(QC1 database) |
| dataset: | flux | • |
| median: | 587 | counts/sec |
| thresholds: | none | |
| N_data plotted: | 87 |
| [click plot for closeup] |
| Plot 6 | | data source: | giraffe_simlamp
(QC1 database) |
| dataset: | flux | • |
| median: | 645 | counts/sec |
| thresholds: | none | |
| N_data plotted: | 88 |
| [click plot for closeup] |
This is the trending plot monitoring the stability of the GIRAFFE SIMCAL arclamp and the 5 fibre systems.
These data are derived from the daily SIMLAMP,TAL health check measurements (5 with the HR grating, H525.8B setting; one with the LR grating, L543.1).
Plots 1-5. For each of the five fibre systems (in H525.8B setting),
an emission line is selected, its intensity
is integrated and divided by the EXPTIME. The resulting flux, in counts/sec, is trended over
time.
Plot 6: The same is done for the Medusa1 L543.1 setting.
If a certain
trend effect is visible in *all* slits, it is likely to be caused by the lamp. If it shows up in one fibre system only, it originates
in that particular fibre system.
Find more information here. The SIMLAMP data are also used to evaluate the
grating stability.
General information
Click on any of the plots to see a close-up version.
The latest date is indicated on top of the plot.
If configured,
- data points belonging to the latest date are specially marked
- statistical averages are indicated by a solid line, and thresholds by broken lines
- outliers are marked by a red asterisk. They are defined as data points outside the
threshold lines
- "aliens" (= data points outside the plot Y limits) are marked by a red arrow (↑ or ↓)
- you can download the data for each parameter set if the 'Data downloads' link shows up
|
