Plot
? |
Symb
? |
Source
* |
Average ? |
Thresholds ? |
N_
data |
QC1
parameter |
Data
downloads |
Remarks |
| method |
value |
unit |
method |
value |
| 1 |
• | QC1DB |
MEDIAN |
0.222 |
pix |
25% | ± 0.0555 |
26 |
rms_fit |
this |
last_yr |
all
|
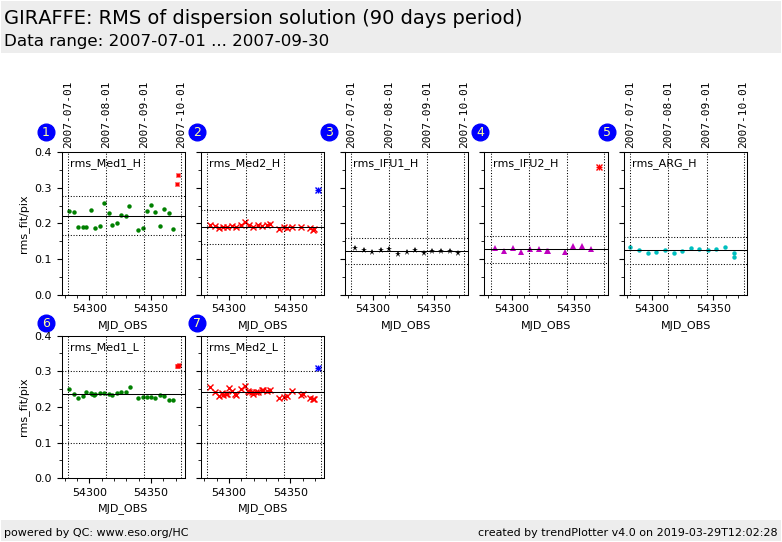
rms of fitted lines (pix); H525.8B, Medusa1 |
| 2 |
x | QC1DB |
MEDIAN |
0.191 |
pix |
25% | ± 0.0478 |
24 |
rms_fit |
this |
last_yr |
all
|
as plot 1, Medusa2 |
| 3 |
∗ | QC1DB |
MEDIAN |
0.123 |
pix |
30% | ± 0.0369 |
13 |
rms_fit |
this |
last_yr |
all
|
as plot 1, IFU1 |
| 4 |
▲ | QC1DB |
MEDIAN |
0.128 |
pix |
30% | ± 0.0383 |
13 |
rms_fit |
this |
last_yr |
all
|
as plot 1, IFU2 |
| 5 |
• | QC1DB |
MEDIAN |
0.125 |
pix |
30% | ± 0.0375 |
14 |
rms_fit |
this |
last_yr |
all
|
as plot 1, Argus |
| 6 |
• | QC1DB |
MEDIAN |
0.236 |
pix |
VAL | 0.1,0.3 |
29 |
rms_fit |
this |
last_yr |
all
|
rms of fitted lines (pix); L543.1, Medusa1 |
| 7 |
x | QC1DB |
MEDIAN |
0.241 |
pix |
VAL | 0.1,0.3 |
33 |
rms_fit |
this |
last_yr |
all
|
... same for Medusa2 |
| |
|
*Data sources: QC1DB: QC1 database; LOCAL: local data source
|
| Plot 1 | | data source: | giraffe_wave
(QC1 database) |
| dataset: | rms_fit | • |
| median: | 0.222 | pix |
| rel. thresholds: ±25% | 0.1666125...0.2776875 | pix |
| N_data plotted: | 26 |
| [click plot for closeup] |
| Plot 2 | | data source: | giraffe_wave
(QC1 database) |
| dataset: | rms_fit | x |
| median: | 0.191 | pix |
| rel. thresholds: ±25% | 0.14325...0.23875 | pix |
| N_data plotted: | 24 |
| [click plot for closeup] |
| Plot 3 | | data source: | giraffe_wave
(QC1 database) |
| dataset: | rms_fit | ∗ |
| median: | 0.123 | pix |
| rel. thresholds: ±30% | 0.0861...0.1599 | pix |
| N_data plotted: | 13 |
| [click plot for closeup] |
| Plot 4 | | data source: | giraffe_wave
(QC1 database) |
| dataset: | rms_fit | ▲ |
| median: | 0.128 | pix |
| rel. thresholds: ±30% | 0.08932...0.16588 | pix |
| N_data plotted: | 13 |
| [click plot for closeup] |
| Plot 5 | | data source: | giraffe_wave
(QC1 database) |
| dataset: | rms_fit | • |
| median: | 0.125 | pix |
| rel. thresholds: ±30% | 0.0875...0.1625 | pix |
| N_data plotted: | 14 |
| [click plot for closeup] |
| Plot 6 | | data source: | giraffe_wave
(QC1 database) |
| dataset: | rms_fit | • |
| median: | 0.236 | pix |
| fixed thresholds: | 0.1...0.3 | pix |
| N_data plotted: | 29 |
| [click plot for closeup] |
| Plot 7 | | data source: | giraffe_wave
(QC1 database) |
| dataset: | rms_fit | x |
| median: | 0.241 | pix |
| fixed thresholds: | 0.1...0.3 | pix |
| N_data plotted: | 33 |
| [click plot for closeup] |
This is the Health Check plot for the
quality of the dispersion solution in the GIRAFFE
arclamp calibration data. We display here the QC1 parameter rms_fit
(PRO.WSOL.RMS) which describes the rms of the residuals of the accepted line
positions against the dispersion
solution. This plot monitors the
HC data taken in high resolution (H525.8B) and low resolution (L543.1, Medusa1
and 2 only).
The arclamp has been replaced on 2013-04-20, since then rms_fit is slightly
higher than before but without quality impact.
Check the N_LINES plot of this group for the number of lines accepted for the
dispersion solution, and the RESOL plot for resolution monitoring.
Check also the ARCLAMP plot under "lamp stability", to check the efficiency of
the ARC lamp.
General information
Click on any of the plots to see a close-up version.
The latest date is indicated on top of the plot.
If configured,
- data points belonging to the latest date are specially marked
- statistical averages are indicated by a solid line, and thresholds by broken lines
- outliers are marked by a red asterisk. They are defined as data points outside the
threshold lines
- "aliens" (= data points outside the plot Y limits) are marked by a red arrow (↑ or ↓)
- you can download the data for each parameter set if the 'Data downloads' link shows up
|
