 mirror sites:
PL (internal link)
HQ
[?]
Quality Control and
Data Processing
|
GIRAFFE: Calibration recipes
DPR.CATG = CALIB, DPR.TYPE = BIAS
Bias frames are measured to monitor the status of the CCD. They come in stacks of 5 raw frames. They are routinely measured every night when GIRAFFE is operational, in the read modes "Normal" and "Fast". They are processed by the pipeline into a MASTER_BIAS. They are scored and quality-checked by QC Garching.
The pipeline recipe gimasterbias processes GIRAFFE BIAS frames. These are combined and median-stacked.
The pipeline measures median values, read noise and global structure in the master BIAS and in the first raw frame.
 DARK frames: gimasterdark
DPR.CATG = CALIB, DPR.TYPE = DARK
Dark frames are measured to monitor the status of the CCD. They come in stacks of 3 raw frames, each with 3600 sec integration time. They are taken about monthly. They are processed into MASTER_DARK frames and are quality-checked by QC Garching. For data taken with the old CCD (until 2008-03), the master_dark is also useful for subtracting the amplifier glow in the upper right edge of the CCD, if this becomes an issue for the data reduction. There is no amplifier glow with the current CCD (used after 2008-03).
The pipeline recipe gimasterdark processes GIRAFFE DARK frames. These are combined and median-stacked.
The pipeline measures median values and dark current in the master DARK frame.
 FLAT frames: gimasterflat
DPR.CATG = CALIB, DPR.TYPE = LAMP,FLAT or LAMP,FLAT,NASMYTH
Flat frames are normally illuminated by the calibration unit on OzPoz, with the lamp moved across the fibres which are arranged in a spiral pattern ('robotic flats'). While this is a good approach for the Medusa and IFU fibres, the Argus fibres are not well illuminated by this procedure. Therefore, there are also Argus flats taken on the illuminated Nasmyth screen ('nasmyth flats'). The flats measure fixed-pattern noise (pixel-to-pixel sensitivity variations), fibre signal localization and width, relative transmission (fibre-to-fibre), fringing (in the red), and the approximate response function. Normally 3 flats are measured and stacked by the pipeline to suppress cosmic ray hits.
The pipeline recipe gimasterflat processes GIRAFFE FLAT frames. The input raw frames (typically three) are debiased, combined, median-stacked and normalized to 1 sec. Next all fibres are localized by a profile fit in the course of the extraction procedure and extracted. Finally they are normalized such that the signal from the fibre with the highest transmission is set to one, and all other fibres are normalized relative to that fibre. In the normalization procedure, all SIMCAL fibres are neglected, as well as the SKY fibres for the IFU and Argus slits. The product files have one column per extracted fibre, plus a binary table as extension, the fibre_setup table which is described here. Only localized and extracted fibres get a column in the products, not any "missing" fibres (both non-allocatable and non-allocated ones). The pipeline measures median/mean and rms of the following parameters: relative fibre transmission; fibre signal curvature; signal width, and the flat-field lamp efficiency.
The error file (PRO.CATG = FF_EXTERRORS) contains the calculated standard deviation per pixel of the FF_EXTSPECTRA file (containing: photon noise, read noise). Products of the Nasmyth flats have similar pro.catg values (with FF replaced by NF), and somewhat different product codes which are listed here.
The red nasmyth flats occasionally show telluric line absorption, due to the lightpath between the calibration lamp, the nasmyth screen and the detector. Note that these features propagate further in the course of the science file reduction and partially cancel out (overlap with) stellar telluric features. See the following plot:
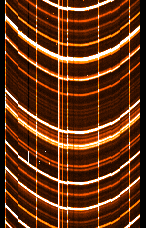
On the extracted fibre signal (FF_EXTSPECTRA) of the current CCD you can sometimes identify regular, low-amplitude features aligned with CCD rows. These are due to the manufacturing process, have a vertical period of 512 pixels and sometimes extend across the whole frame, sometimes across the half. They are caused by small gain variations and correctly recorded in the flats. They are much better visible on well-exposed image flats taken for detector monitoring (see below). In the example below, you can also identify vertical patterns at even lower amplitude, due to the same effect.
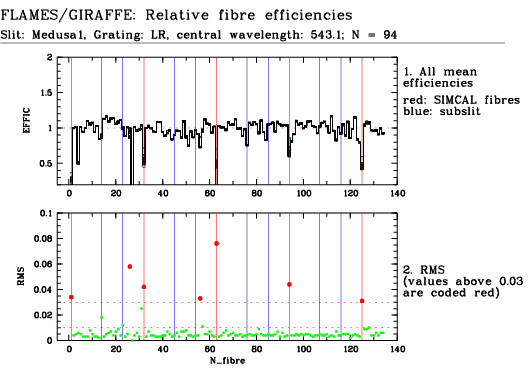
An important property of the GIRAFFE fibres is the stability of their relative transmission, since the SKY signal can only be recorded in dedicated (IFU and Argus) or user-selected (Medusa) fibres. The level of precision of sky subtraction is therefore limited by the accuracy of the relative fibre transmission as recorded by the flats. The following figure demonstrates that the sky signal can be measured with a precision of much better than 1% for most of the fibres.
While Medusa and IFU flats are sufficiently uniform when obtained with the robotic lamp, the Argus fibres are not completely illuminated by the robotic calibration lamp. The differences between a 'robotic' Argus flat and a Nasmyth flat are shown below.
The next figure compares a Nasmyth flat and a sky flat. The sky flat has been taken in twilight conditions on the sky and avoids all residual illumination artefacts which could degrade the Nasmyth flat.
This figure demonstrates that Argus data can be reliably flattened with the Nasmyth flats. This is also evident from the following figure which compares the non-flattened skyflat (below) and the skyflat after flattening with the nasmyth flat (top). The bumps and wiggles have disappeared, and the residual transmission differences are about 2.4% rms.
 WAVE frames: giwavecalibration
DPR.CATG = CALIB, DPR.TYPE = LAMP,WAVE
WAVE frames are illuminated by the arclamp calibration unit on OzPoz, with the lamp moved across the fibres which are arranged in a spiral pattern. The arclamp frames are used to derive the global dispersion solution for science (and STD) frames. The pipeline recipe giwavecalibration processes GIRAFFE WAVE frames. The input raw frame is debiased. The corresponding localization (PLOC) and width (PWID) solutions from the gimasterflat recipe are used to localize and extract the fibre signals. The line catalog is searched for matching emission lines which are then identified in the fibre signals. Blended, saturated and too faint lines are rejected, as well as lines with a non-Gaussian PSF. The Giraffe optical model is globally fitted. The residuals between that solution and the positions of the identified emission lines are fitted by a 2D Chebychev polynomial to obtain the complete dispersion solution. Small fibre-to-fibre differences are taken into account by the static slit geometry setup table and the grating table. The extracted arclamp frame is finally wavelength calibrated and rebinned, to deliver a product suitable for quality control checks.
The pipeline measures the mean flux level of the raw input frame, the number of saturated pixels, the calibration lamp efficiency, the rms of the dispersion solution, the number of lines found, accepted, and used for the fit.
The error files (PRO.CATG = ARC_EXTERRORS and ARC_RBNERRORS) contain the calculated standard deviation per pixel of the ARC_EXTSPECTRA file (containing: photon noise, read noise).  STD frames: gistandard
DPR.CATG = CALIB, DPR.TYPE = STD,OzPoz (or SimCal), DPR.TECH=IFU
Flux STD frames are regularly taken only for ARGUS and IFU observations. They can be used for response correction and flux calibration. They are usually followed by three Nasmyth flat exposures. For efficiency monitoring, there is also a dedicated set of Argus settings taken about once a month.
The recipe processes the flux STD data just like the science data, with two important differences: no fibre-to-fibre transmission correction is applied, and (for Argus data only) a response curve and an efficiency curve are calculated as the final step.
Checks are done for over and underexposure.
The error file (PRO.CATG = ARC_RBNERRORS) contains the calculated standard deviation per pixel of the ARC_RBNSPECTRA file (containing: photon noise, read noise). This error is propagated to the error file of the recombined spectro-image, STD_RCERRORS. |
||||||||||||||||||||||||||||||||||||||||||||||||||||||||||||||||||||||||||||||||||||||||||||||||||||||||||||||||||||||||||||||||||||||||||||||||||||||||||||||||||||||||||||||||||||||||||||||||||||||||||||||||||||||||||||||||||||||||||||||||||||||||||||||||||||||||||||||||||||||||
| |
|||||||||||||||||||||||||||||||||||||||||||||||||||||||||||||||||||||||||||||||||||||||||||||||||||||||||||||||||||||||||||||||||||||||||||||||||||||||||||||||||||||||||||||||||||||||||||||||||||||||||||||||||||||||||||||||||||||||||||||||||||||||||||||||||||||||||||||||||||||||||
 |
|
||||||||||||||||||||||||||||||||||||||||||||||||||||||||||||||||||||||||||||||||||||||||||||||||||||||||||||||||||||||||||||||||||||||||||||||||||||||||||||||||||||||||||||||||||||||||||||||||||||||||||||||||||||||||||||||||||||||||||||||||||||||||||||||||||||||||||||||||||||||||


