[page auto-refreshes after 300 sec]   [stop | on]            [press Ctrl+Shift+R to enforce refresh of scores, dates and news]
FORS2 trending system: FULL report
HELP USERS-GUIDE MORE
Last update: 2024-06-29T17:13:55 (UT)
  | now: 2024-06-29T18:51:30 (UT) muc01 QC pipeline: fors-5.6.10 (installed 2024-04-19)
close window history: 2008 2009 2010 2011 2012 2013 2014 2015 2016 2017 2018 2019 2020 2021 2022 2023   2024   HEALTH FULL
  ... ... ... ... ... ... ... ... ... ... ... ... ... ... ...
*Date on this monitor changes at 21:00 UT
png: Information and research:
- png file - advanced studies: QC1 browser | QC1 plotter
Plot
?
Symb
?
Source
*
Average ? Thresholds ? N_
data
QC1
parameter
Data
downloads
Remarks
method value unit method value
1 oQC1DB MEDIAN 1e-05 NONE none  285 non_linear all (full time range) non-linearity for chip 1, high gain, all filters
2 oQC1DB MEDIAN 0.00423 NONE none  283 non_linear all (full time range) non-linearity for chip 2, high gain, all filters
3 oQC1DB MEDIAN 0.00918 NONE none  334 non_linear all (full time range) non-linearity for chip 1, low gain, all filters
4 oQC1DB MEDIAN 0.014 NONE none  335 non_linear all (full time range) non-linearity for chip 2, low gain, all filters
*Data sources: QC1DB: QC1 database; LOCAL: local data source
Plot 1
scores: not implemented
data source:fors2_detmon
(QC1 database)
dataset:non_linearo
median:1e-05NONE
thresholds:none 
N_data plotted:285
[click plot for closeup]
Plot 2
scores: not implemented
data source:fors2_detmon
(QC1 database)
dataset:non_linearo
median:0.00423NONE
thresholds:none 
N_data plotted:283
[click plot for closeup]
Plot 3
scores: not implemented
data source:fors2_detmon
(QC1 database)
dataset:non_linearo
median:0.00918NONE
thresholds:none 
N_data plotted:334
[click plot for closeup]
Plot 4
scores: not implemented
data source:fors2_detmon
(QC1 database)
dataset:non_linearo
median:0.014NONE
thresholds:none 
N_data plotted:335
[click plot for closeup]
This plot

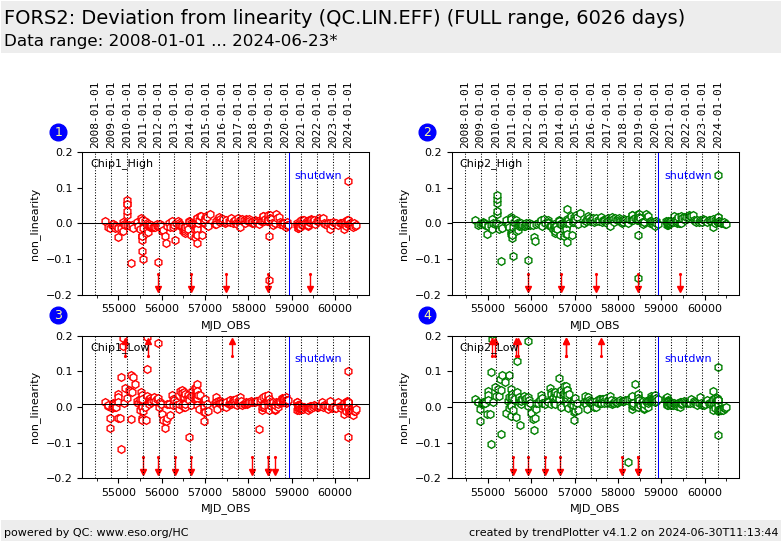
These plots show the difference at a given ref_level between the flux obtained from 2nd order polynomial fit of flux vs. exposure time and the flux predicted by the linear term only, normalized by the polynomial flux. Since data taken after 2009-10 rarely reach 60000 ADU we changed this ref_level from 60000 ADU to 40000 ADU, starting 2009-10. More information can be found on the plot tutorial page  


General information

Click on any of the plots to see a close-up version.

The latest date is indicated on top of the plot.

If configured,

  • data points belonging to the latest date are specially marked
  • statistical averages are indicated by a solid line, and thresholds by broken lines
  • outliers are marked by a red asterisk. They are defined as data points outside the threshold lines
  • "aliens" (= data points outside the plot Y limits) are marked by a red arrow ( or )
  • you can download the data for each parameter set if the 'Data downloads' link shows up