|
[page auto-refreshes after 60 sec]
[press Ctrl+R to enforce refresh of scores and dates]
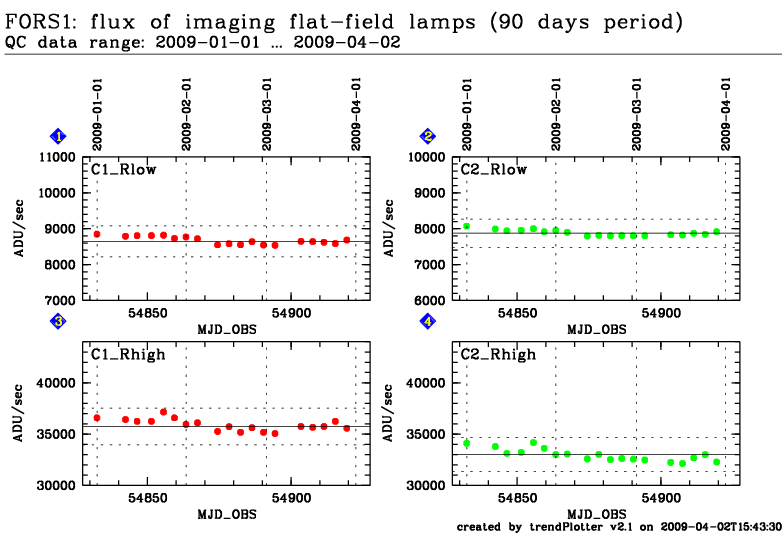
| FORS1 trending system: HISTORY plot |
|
Last update: 2009-04-02T15:43:47 (UT)
|
|
|
|
|

|
|
|
Plot
? |
Symb
? |
Source
* |
Average ? |
Thresholds ? |
N_
data |
QC1
parameter |
Data
downloads |
Remarks |
| method |
value |
unit |
method |
value |
| 1 |
• | QC1DB |
MEDIAN |
8647.50293 |
ADU |
5% | ± 432.37515 |
19 |
efficiency |
this |
last_yr |
all
|
R_BESS, low gain |
| 2 |
• | QC1DB |
MEDIAN |
7873.90234 |
ADU |
5% | ± 393.69513 |
19 |
efficiency |
this |
last_yr |
all
|
R_BESS, low gain |
| 3 |
• | QC1DB |
MEDIAN |
35741.27344 |
ADU |
5% | ± 1787.06372 |
19 |
efficiency |
this |
last_yr |
all
|
R_BESS, high gain |
| 4 |
• | QC1DB |
MEDIAN |
32999.51562 |
ADU |
5% | ± 1649.97583 |
19 |
efficiency |
this |
last_yr |
all
|
R_BESS, high gain |
| |
|
*Data sources: QC1DB: QC1 database; LOCAL: local text file
|
General information
Click on any of the plots to see a close-up version.
The latest date is indicated on top of the plot, data points belonging to that date are specially marked.
If configured,
- statistical averages are indicated by a solid line, and thresholds by broken lines
- outliers are marked by a red asterisk. They are defined as data points outside the
threshold lines
- "aliens" (= data points outside the plot Y limits) are marked by a red arrow (↑ or ↓)
- you can download the data for each parameter set if the 'Data downloads' link shows up
|
|