|
[page auto-refreshes after 60 sec]
[press Ctrl+R to enforce refresh of scores and dates]
| FORS1 trending system: HISTORY plot |
|
Last update: 2009-02-20T14:36:18 (UT)
|
|
|
|
|

|
|
|
Plot
? |
Symb
? |
Source
* |
Average ? |
Thresholds ? |
N_
data |
QC1
parameter |
Data
downloads |
Remarks |
| method |
value |
unit |
method |
value |
| 1 |
• | QC1DB |
none |
|
mag |
none | |
29 |
zp_frame |
this |
last_yr |
all
|
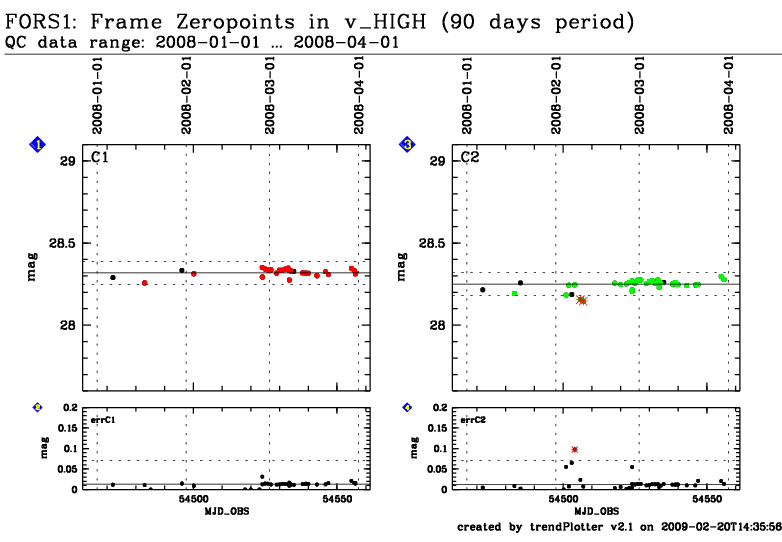
Frame zeropoint from e-/sec (more than 1 star) |
| 1 |
• | QC1DB |
MEDIAN |
28.3184 |
mag |
OFF | ± 0.07 |
26 |
zp_frame |
this |
last_yr |
all
|
Frame zeropoint from e-/sec (photometric nights only) |
| 2 |
• | QC1DB |
MEDIAN |
0.01316 |
mag |
VAL | 0,0.07 |
33 |
sig_zp_frame |
this |
last_yr |
all
|
error of frame zeropoint from e-/sec |
| 3 |
• | QC1DB |
none |
|
mag |
none | |
36 |
zp_frame |
this |
last_yr |
all
|
Frame zeropoint from e-/sec (more than 1 star) |
| 3 |
• | QC1DB |
MEDIAN |
28.2505 |
mag |
OFF | ± 0.07 |
32 |
zp_frame |
this |
last_yr |
all
|
Frame zeropoint from e-/sec (photometric nights only) |
| 4 |
• | QC1DB |
MEDIAN |
0.01184 |
mag |
VAL | 0,0.07 |
37 |
sig_zp_frame |
this |
last_yr |
all
|
error of frame zeropoint from e-/sec |
| |
|
*Data sources: QC1DB: QC1 database; LOCAL: local text file
|
This plot
Trending is done only for the SR collimator. For the old CCD (until
2007-03-25) only 1x1 binning data are trended. For the new CCDs (since
2007-04-01) only 2x2 binning data are trended. Photometric nights are
selected from the Absorption Monitor. Zeropoints are per frame for flux in
e-/sec, not in ADU. Do not use these zeropoints for science
data. They are reduced assuming a standard extinction value, which
may not be correct for an individual night!
General information
Click on any of the plots to see a close-up version.
The latest date is indicated on top of the plot, data points belonging to that date are specially marked.
If configured,
- statistical averages are indicated by a solid line, and thresholds by broken lines
- outliers are marked by a red asterisk. They are defined as data points outside the
threshold lines
- "aliens" (= data points outside the plot Y limits) are marked by a red arrow (↑ or ↓)
- you can download the data for each parameter set if the 'Data downloads' link shows up
|
|