 mirror sites:
PL (internal link)
HQ
[?]
Quality Control and
Data Processing
|
ESPRESSO: Order definition
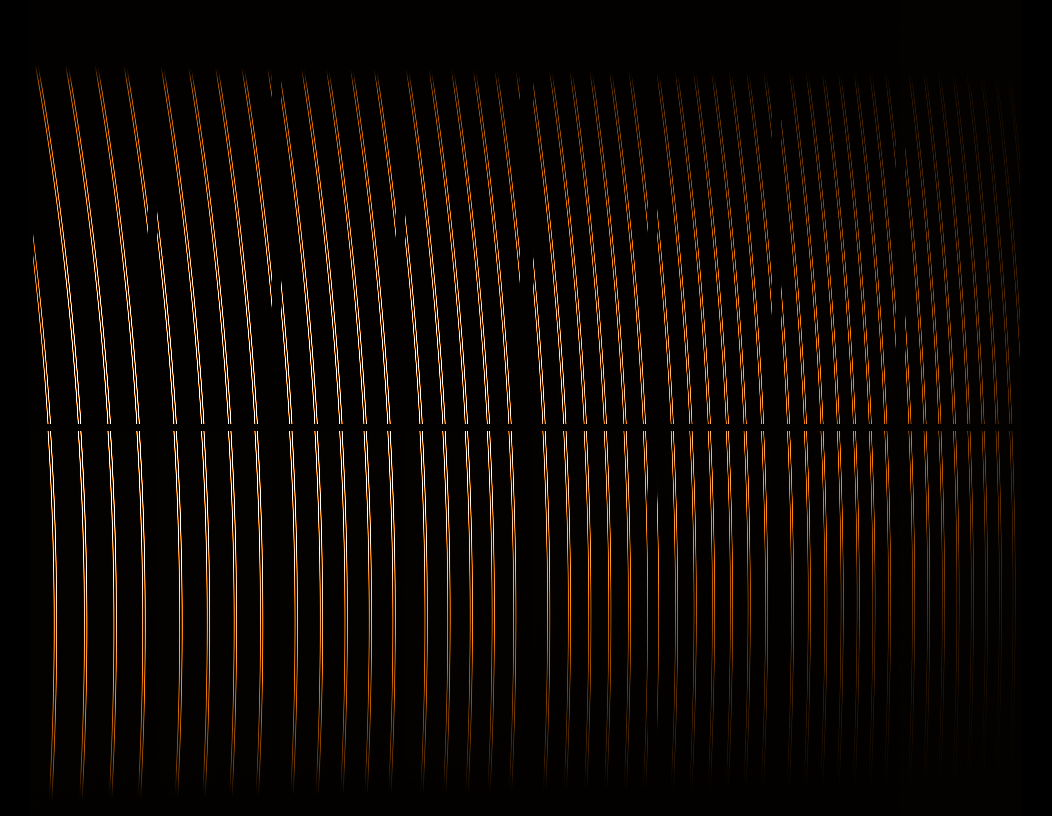
Order-definition frames are spectroscopic flat fields. They are used to trace and identify spectral orders on the detector. There is one frame per input fibre (A or B). They are measured daily in HR with 1x1 and 2x1 binning; order-definition frames for UHR and MR are typically taken only when UHR or MR science data have been observed during the night.
 Number of identified orders
The number of orders is trended separately for the five different combinations of resolving power and binning: HR with 1x1 and 2x1 binning, UHR with 1x1 binning, and MR with 4x2 and 8x4 binning. Scoring&thresholds Number of identified orders The number of orders must be exactly 170 for HR and UHR and 85 for MR. No particular events. Algorithm Number of identified orders The number of orders as identified by the pipeline for each fibre. Due to ESPRESSO's optical design, each fibre has two images on the detector. In HR and UHR, these images are separated well enough so that they are counted as separate orders by the pipeline recipe. This gives 90 orders on the blue chip and 80 orders on the red. In MR, the two fibre images overlap and the pipeline counts them as one order. This means 45 orders on the blue and 40 orders on the red chip.  Order position
For monitoring purposes, a central order has been chosen on each chip. The following table gives the relation between physical order and order number as given by the pipeline (and used in the header keyword names). The pipeline order number is also recorded in the QC1 database key espresso_orderdef..pipe_centorder.
The position of a central order on each chip is trended separately for the five different combinations of resolving power and binning: HR with 1x1 and 2x1 binning, UHR with 1x1 binning, and MR with 4x2 and 8x4 binning. Scoring&thresholds Order position Scoring is not implemented.
Pipeline calculated QC parameters. |
|||||||||||||||||||||||||||||||||||||||||||||||||||||||||||||||||||||||||||||||||||||||||||||||||||||||||||||||||||||||||||||||||||||||||||||||||||||||||||||||||||||||||||||||||||||||||||||||||||||||||||||||||||||||||||||||||||||||||||||||||||||||||||||||||||||||||||||||||||||||||||||||||||||||||||||||||||||||||||||||||||||||||||||||||||||||||||||||||||||||||||||||||||||||||||||||||||||||||||||||||||||||||||||||||||||||||||||||
| |
||||||||||||||||||||||||||||||||||||||||||||||||||||||||||||||||||||||||||||||||||||||||||||||||||||||||||||||||||||||||||||||||||||||||||||||||||||||||||||||||||||||||||||||||||||||||||||||||||||||||||||||||||||||||||||||||||||||||||||||||||||||||||||||||||||||||||||||||||||||||||||||||||||||||||||||||||||||||||||||||||||||||||||||||||||||||||||||||||||||||||||||||||||||||||||||||||||||||||||||||||||||||||||||||||||||||||||||||
 |
|
|||||||||||||||||||||||||||||||||||||||||||||||||||||||||||||||||||||||||||||||||||||||||||||||||||||||||||||||||||||||||||||||||||||||||||||||||||||||||||||||||||||||||||||||||||||||||||||||||||||||||||||||||||||||||||||||||||||||||||||||||||||||||||||||||||||||||||||||||||||||||||||||||||||||||||||||||||||||||||||||||||||||||||||||||||||||||||||||||||||||||||||||||||||||||||||||||||||||||||||||||||||||||||||||||||||||||||||||
