 mirror sites:
PL (internal link)
HQ
[?]
Quality Control and
Data Processing
|
ESPRESSO: Spectroscopic flat fields
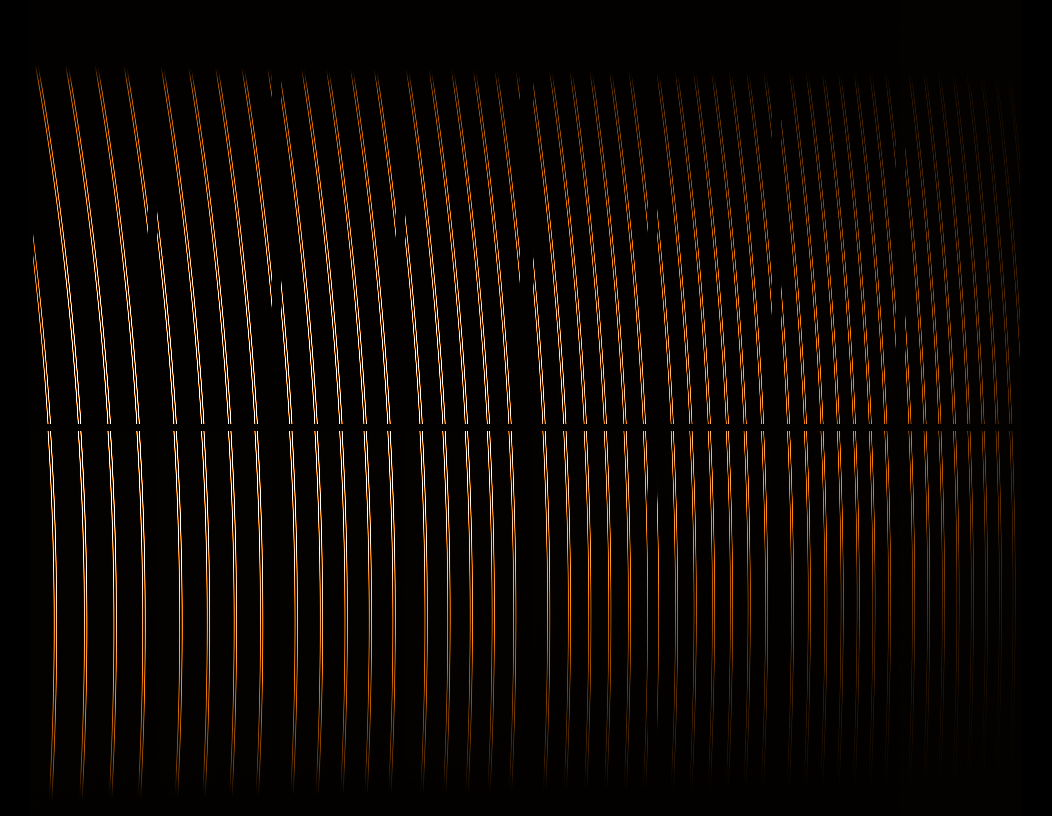
Spectroscopic flat fields are used for determining the order profiles and the blaze functions per order. There are typically ten frames per input fibre (A or B). They are measured daily in HR with 1x1 and 2x1 binning; flat fields for UHR and MR are normally taken only when UHR or MR science data have been observed during the night.
 Signal-to-noise ratio
The minimum signal-to-noise ratio per order is trended separately for fibres A and B and for the five different combinations of resolving power and binning: HR with 1x1 and 2x1 binning, UHR with 1x1 binning, and MR with 4x2 and 8x4 binning. Scoring&thresholds Signal-to-noise ratio Thresholds have not yet been defined. No particular events. Algorithm Signal-to-noise ratio The pipeline calculates the signal-to-noise ratio for each order. The QC procedure determines from these values the minimum per fibre.  Counts and saturation check
The maximum number of counts is trended separately for fibres A and B, for both detectors, and for the five different combinations of resolving power and binning: HR with 1x1 and 2x1 binning, UHR with 1x1 binning, and MR with 4x2 and 8x4 binning. Scoring&thresholds Counts and saturation check The upper limit has been set to 60000 ADU which is slightly below the saturation limit of 65535 ADU. The lower limit is at 20000 ADU which represents the accepted range in early operations. Data taken before October 2010 have been processed with a pipeline version that converted ADUs into electrons (with about 1.1 e-/ADU). Algorithm Counts and saturation check Pipeline calculated values per read-out port. The QC script uses these values to determine the maximum for each of the chips. |
|||||||||||||||||||||||||||||||||||||||||||||||||||||||||||||||||||||||||||||||||||||||||||||||||||||||||||||||||||||||||||||||||||||||||||||||||||||||||||||||||||||||||||||||||||||||||||||||||||||||||||||||||||||||||||||||||||||||||||||||||||||||||||||||||||||||||||||||||||||||||||||||||||||||||||||||||||||||||||||||||||||||||||||||||||||||||||||||||||||||||||||||||||||||||||||||||||||||||||||||||||||||||||||||
| |
||||||||||||||||||||||||||||||||||||||||||||||||||||||||||||||||||||||||||||||||||||||||||||||||||||||||||||||||||||||||||||||||||||||||||||||||||||||||||||||||||||||||||||||||||||||||||||||||||||||||||||||||||||||||||||||||||||||||||||||||||||||||||||||||||||||||||||||||||||||||||||||||||||||||||||||||||||||||||||||||||||||||||||||||||||||||||||||||||||||||||||||||||||||||||||||||||||||||||||||||||||||||||||||||
 |
|
|||||||||||||||||||||||||||||||||||||||||||||||||||||||||||||||||||||||||||||||||||||||||||||||||||||||||||||||||||||||||||||||||||||||||||||||||||||||||||||||||||||||||||||||||||||||||||||||||||||||||||||||||||||||||||||||||||||||||||||||||||||||||||||||||||||||||||||||||||||||||||||||||||||||||||||||||||||||||||||||||||||||||||||||||||||||||||||||||||||||||||||||||||||||||||||||||||||||||||||||||||||||||||||||
