Plot
? |
Symb
? |
Source
* |
Average ? |
Thresholds ? |
N_
data |
QC1
parameter |
Data
downloads |
Remarks |
| method |
value |
unit |
method |
value |
| 1 |
• | QC1DB |
MEDIAN |
2676.77 |
ADU/sec |
VAL | 800,5000 |
76 |
mean_flux |
this |
last_yr |
all
|
Halogen lamp, chip 1, WREF=2199.1 |
| 2 |
• | QC1DB |
MEDIAN |
2515.06 |
ADU/sec |
VAL | 800,4500 |
76 |
mean_flux |
this |
last_yr |
all
|
Halogen lamp, chip 2, WREF=2199.1 |
| 3 |
• | QC1DB |
MEDIAN |
1749.91 |
ADU/sec |
VAL | 500,3500 |
76 |
mean_flux |
this |
last_yr |
all
|
Halogen lamp, chip 3, WREF=2199.1 |
| 4 |
• | QC1DB |
MEDIAN |
1250.26 |
ADU/sec |
VAL | 300,2500 |
76 |
mean_flux |
this |
last_yr |
all
|
Halogen lamp, chip 4, WREF=2199.1 |
| 5 |
• | QC1DB |
MEDIAN |
145.151 |
ADU/sec |
none | |
76 |
mean_flux |
this |
last_yr |
all
|
IR emitter, chip 1, WREF=2199.1 |
| 6 |
• | QC1DB |
MEDIAN |
138.479 |
ADU/sec |
none | |
76 |
mean_flux |
this |
last_yr |
all
|
IR emitter, chip 2, WREF=2199.1 |
| 7 |
• | QC1DB |
MEDIAN |
99.6625 |
ADU/sec |
none | |
76 |
mean_flux |
this |
last_yr |
all
|
IR emitter, chip 3, WREF=2199.1 |
| 8 |
• | QC1DB |
MEDIAN |
74.073 |
ADU/sec |
none | |
76 |
mean_flux |
this |
last_yr |
all
|
IR emitter, chip 4, WREF=2199.1 |
| |
|
*Data sources: QC1DB: QC1 database; LOCAL: local text file
|
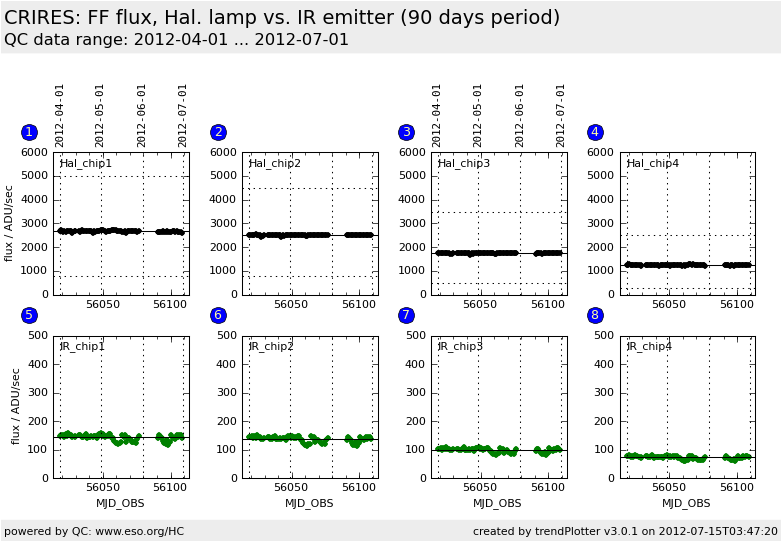
| Plot 1 | | data source: | crires_flat
(QC1 database) |
| dataset: | mean_flux | • |
| median: | 2676.77 | ADU/sec |
| fixed thresholds: | 800...5000 | ADU/sec |
| N_data plotted: | 76 |
| [click on plot for closeup] |
| Plot 2 | | data source: | crires_flat
(QC1 database) |
| dataset: | mean_flux | • |
| median: | 2515.06 | ADU/sec |
| fixed thresholds: | 800...4500 | ADU/sec |
| N_data plotted: | 76 |
| [click on plot for closeup] |
| Plot 3 | | data source: | crires_flat
(QC1 database) |
| dataset: | mean_flux | • |
| median: | 1749.91 | ADU/sec |
| fixed thresholds: | 500...3500 | ADU/sec |
| N_data plotted: | 76 |
| [click on plot for closeup] |
| Plot 4 | | data source: | crires_flat
(QC1 database) |
| dataset: | mean_flux | • |
| median: | 1250.26 | ADU/sec |
| fixed thresholds: | 300...2500 | ADU/sec |
| N_data plotted: | 76 |
| [click on plot for closeup] |
| Plot 5 | | data source: | crires_flat
(QC1 database) |
| dataset: | mean_flux | • |
| median: | 145.151 | ADU/sec |
| thresholds: | none | |
| N_data plotted: | 76 |
| [click on plot for closeup] |
| Plot 6 | | data source: | crires_flat
(QC1 database) |
| dataset: | mean_flux | • |
| median: | 138.479 | ADU/sec |
| thresholds: | none | |
| N_data plotted: | 76 |
| [click on plot for closeup] |
| Plot 7 | | data source: | crires_flat
(QC1 database) |
| dataset: | mean_flux | • |
| median: | 99.6625 | ADU/sec |
| thresholds: | none | |
| N_data plotted: | 76 |
| [click on plot for closeup] |
| Plot 8 | | data source: | crires_flat
(QC1 database) |
| dataset: | mean_flux | • |
| median: | 74.073 | ADU/sec |
| thresholds: | none | |
| N_data plotted: | 76 |
| [click on plot for closeup] |
Trending plots monitoring the flux in flat-fields taken with the Halogen lamp or
with the IR emitter.
These flats are measured daily with a reference wavelength of 2199.1 nm.
The exposures are taken for QC purposes; only the Halogen lamp is also
used in other flat-field measurements that are intended for science calibration.
General information
Click on any of the plots to see a close-up version.
The latest date is indicated on top of the plot, data points belonging to that date are specially marked.
If configured,
- statistical averages are indicated by a solid line, and thresholds by broken lines
- outliers are marked by a red asterisk. They are defined as data points outside the
threshold lines
- "aliens" (= data points outside the plot Y limits) are marked by a red arrow (↑ or ↓)
- you can download the data for each parameter set if the 'Data downloads' link shows up
|
