Plot
? |
Symb
? |
Source
* |
Average ? |
Thresholds ? |
N_
data |
QC1
parameter |
Data
downloads |
Remarks |
| method |
value |
unit |
method |
value |
| 1 |
• | QC1DB |
MEDIAN |
3.42612 |
ADU |
VAL | 3.3,3.65 |
81 |
ron23 |
this |
last_yr |
all
|
RON, chip 1, DIT=1 |
| 2 |
• | QC1DB |
MEDIAN |
3.61424 |
ADU |
VAL | 3.4,3.9 |
81 |
ron23 |
this |
last_yr |
all
|
RON, chip 2, DIT=1 |
| 3 |
• | QC1DB |
MEDIAN |
3.61197 |
ADU |
VAL | 3.3,4.0 |
81 |
ron23 |
this |
last_yr |
all
|
RON, chip 3, DIT=1 |
| 4 |
• | QC1DB |
MEDIAN |
4.01584 |
ADU |
VAL | 3.7,4.5 |
81 |
ron23 |
this |
last_yr |
all
|
RON, chip 4, DIT=1 |
| 5 |
• | QC1DB |
MEDIAN |
1.71871 |
ADU |
VAL | 1.5,2.0 |
89 |
ron23 |
this |
last_yr |
all
|
RON, chip 1, DIT=300 |
| 6 |
• | QC1DB |
MEDIAN |
2.03542 |
ADU |
VAL | 1.8,2.5 |
88 |
ron23 |
this |
last_yr |
all
|
RON, chip 2, DIT=300 |
| 7 |
• | QC1DB |
MEDIAN |
2.11759 |
ADU |
VAL | 1.9,2.6 |
89 |
ron23 |
this |
last_yr |
all
|
RON, chip 3, DIT=300 |
| 8 |
• | QC1DB |
MEDIAN |
2.01916 |
ADU |
VAL | 1.7,2.5 |
89 |
ron23 |
this |
last_yr |
all
|
RON, chip 4, DIT=300 |
| |
|
*Data sources: QC1DB: QC1 database; LOCAL: local text file
|
| Plot 1 | | data source: | crires_dark
(QC1 database) |
| dataset: | ron23 | • |
| median: | 3.42612 | ADU |
| fixed thresholds: | 3.3...3.65 | ADU |
| N_data plotted: | 81 |
| [click on plot for closeup] |
| Plot 2 | | data source: | crires_dark
(QC1 database) |
| dataset: | ron23 | • |
| median: | 3.61424 | ADU |
| fixed thresholds: | 3.4...3.9 | ADU |
| N_data plotted: | 81 |
| [click on plot for closeup] |
| Plot 3 | | data source: | crires_dark
(QC1 database) |
| dataset: | ron23 | • |
| median: | 3.61197 | ADU |
| fixed thresholds: | 3.3...4 | ADU |
| N_data plotted: | 81 |
| [click on plot for closeup] |
| Plot 4 | | data source: | crires_dark
(QC1 database) |
| dataset: | ron23 | • |
| median: | 4.01584 | ADU |
| fixed thresholds: | 3.7...4.5 | ADU |
| N_data plotted: | 81 |
| [click on plot for closeup] |
| Plot 5 | | data source: | crires_dark
(QC1 database) |
| dataset: | ron23 | • |
| median: | 1.71871 | ADU |
| fixed thresholds: | 1.5...2 | ADU |
| N_data plotted: | 89 |
| [click on plot for closeup] |
| Plot 6 | | data source: | crires_dark
(QC1 database) |
| dataset: | ron23 | • |
| median: | 2.03542 | ADU |
| fixed thresholds: | 1.8...2.5 | ADU |
| N_data plotted: | 88 |
| [click on plot for closeup] |
| Plot 7 | | data source: | crires_dark
(QC1 database) |
| dataset: | ron23 | • |
| median: | 2.11759 | ADU |
| fixed thresholds: | 1.9...2.6 | ADU |
| N_data plotted: | 89 |
| [click on plot for closeup] |
| Plot 8 | | data source: | crires_dark
(QC1 database) |
| dataset: | ron23 | • |
| median: | 2.01916 | ADU |
| fixed thresholds: | 1.7...2.5 | ADU |
| N_data plotted: | 89 |
| [click on plot for closeup] |
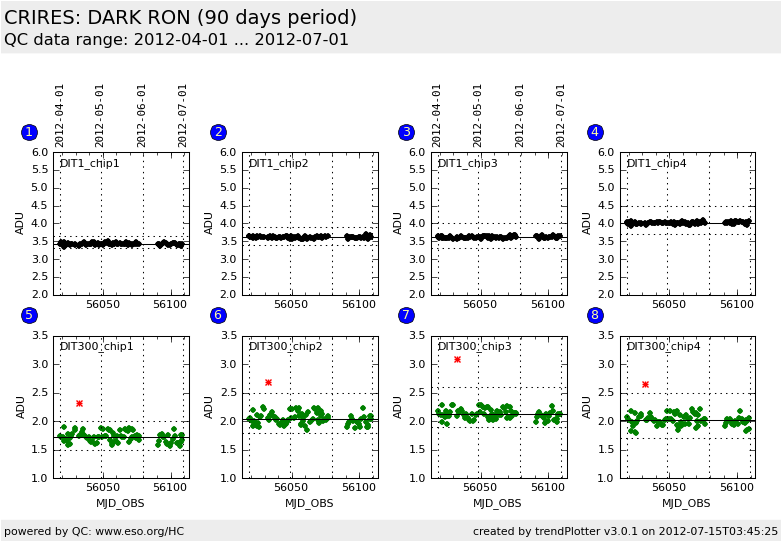
Trending plot for CRIRES RON as determined from DARK exposures.
The read-out noise is measured from the difference of the 3rd and 2nd dark
image using the following procedure:
- generate 100 13x13 pixel windows
- compute the pixel standard deviation in each window
- the read-out noise is the median of these measurements multiplied with
sqrt(NDIT/2).
The trending shows RON from DIT=1sec and DIT=300sec exposures for all
four chips.
General information
Click on any of the plots to see a close-up version.
The latest date is indicated on top of the plot, data points belonging to that date are specially marked.
If configured,
- statistical averages are indicated by a solid line, and thresholds by broken lines
- outliers are marked by a red asterisk. They are defined as data points outside the
threshold lines
- "aliens" (= data points outside the plot Y limits) are marked by a red arrow (↑ or ↓)
- you can download the data for each parameter set if the 'Data downloads' link shows up
|
