Plot
? |
Symb
? |
Source
* |
Average ? |
Thresholds ? |
N_
data |
QC1
parameter |
Data
downloads |
Remarks |
| method |
value |
unit |
method |
value |
| 1 |
• | QC1DB |
MEDIAN |
2164.24219 |
ADU/sec |
3SIG | ± 1158.66675 |
62 |
mean_flux |
this |
last_yr |
all
|
Halogen lamp, chip 1, WREF=2199.1 |
| 2 |
• | QC1DB |
MEDIAN |
1844.08838 |
ADU/sec |
3SIG | ± 1023.7121 |
62 |
mean_flux |
this |
last_yr |
all
|
Halogen lamp, chip 2, WREF=2199.1 |
| 3 |
• | QC1DB |
MEDIAN |
1225.15991 |
ADU/sec |
3SIG | ± 758.61304 |
62 |
mean_flux |
this |
last_yr |
all
|
Halogen lamp, chip 3, WREF=2199.1 |
| 4 |
• | QC1DB |
MEDIAN |
863.8078 |
ADU/sec |
3SIG | ± 508.73633 |
62 |
mean_flux |
this |
last_yr |
all
|
Halogen lamp, chip 4, WREF=2199.1 |
| 5 |
• | QC1DB |
MEDIAN |
153.95279 |
ADU/sec |
3SIG | ± 717.27832 |
63 |
mean_flux |
this |
last_yr |
all
|
IR emitter, chip 1, WREF=2199.1 |
| 6 |
• | QC1DB |
MEDIAN |
133.18985 |
ADU/sec |
3SIG | ± 634.98511 |
63 |
mean_flux |
this |
last_yr |
all
|
IR emitter, chip 2, WREF=2199.1 |
| 7 |
• | QC1DB |
MEDIAN |
91.32564 |
ADU/sec |
3SIG | ± 425.44601 |
63 |
mean_flux |
this |
last_yr |
all
|
IR emitter, chip 3, WREF=2199.1 |
| 8 |
• | QC1DB |
MEDIAN |
64.30984 |
ADU/sec |
3SIG | ± 317.38904 |
63 |
mean_flux |
this |
last_yr |
all
|
IR emitter, chip 4, WREF=2199.1 |
| |
|
*Data sources: QC1DB: QC1 database; LOCAL: local text file
|
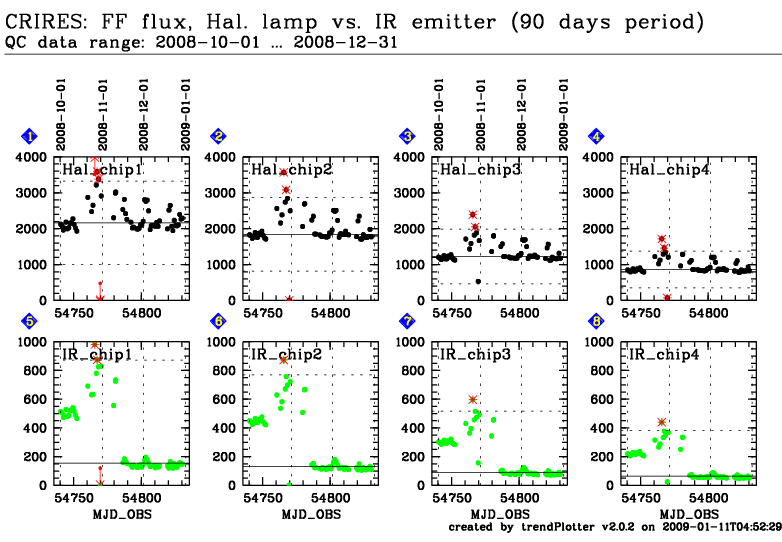
This plot
Trending plots monitoring the flux in flat-fields taken with the Halogen lamp or
with the IR emitter.
These flats are measured daily with a reference wavelength of 2199.1 nm.
The exposures are taken for QC purposes; only the Halogen lamp is also
used in other flat-field measurements that are intended for science calibration.
General information
Click on any of the plots to see a close-up version.
The latest date is indicated on top of the plot, data points belonging to that date are specially marked.
If configured,
- statistical averages are indicated by a solid line, and thresholds by broken lines
- outliers are marked by a red asterisk. They are defined as data points outside the
threshold lines
- "aliens" (= data points outside the plot Y limits) are marked by a red arrow (↑ or ↓)
- you can download the data for each parameter set if the 'Data downloads' link shows up
|
