[an error occurred while processing this directive]
        [page auto-refreshes after 300 sec]   [stop | on]            [press Ctrl+R to enforce refresh of scores and dates]
AMBER trending system: FULL report
HELP USERS-GUIDE MORE
Last update: 2012-11-20T14:04:25 (UT)
| now: 2024-07-17T09:37:43 (UT) | QC pipeline: amber-4.2.1 (installed 2012-11-08)
General news: NOTE: The Health Check and calChecker services are moved to qcFlow on an instrument by instrument basis. The current pages will not be updated any longer once the move has been finished.
The links to KMOS, UVES, and ESPRESSO have been moved to a new section (qcFlow operational) at the lower part of the navigation bar.
AMBER news: 2018-09-06 Last data taken with AMBER.
Report news:
[an error occurred while processing this directive]
DATE*: [?] 2018-09-10
no data | NLT
2018-09-11
no data | NLT
2018-09-12
no data | NLT
2018-09-13
no data | NLT
2018-09-14
no data | NLT
2018-09-15
no data | NLT
2018-09-16
no data | NLT
r...
Raw CAL displays:
no CAL raw files no CAL raw files no CAL raw files no CAL raw files no CAL raw files no CAL raw files no CAL raw files
P...
CAL product quality:
no CAL products no CAL products no CAL products no CAL products no CAL products no CAL products no CAL products
  no OPSLOG data  
Print: Information and research:
- png file - advanced studies: QC1 browser | QC1 plotter
Plot
?
Symb
?
Source
*
OPS?
**
Average ? Thresholds ? N_
data
QC1
parameter
Data
downloads
Remarks
method value unit method value
1 *QC1DB no none   NONE VAL0,300 13 bad_pixels   numb_Bad_Pixels
2 *QC1DB no none   NONE VAL0,.11 13 bad_pixels_ratio    
*Data sources: QC1DB: QC1 database; LOCAL: local text file | **OPS: to indicate that OPSLOG data are included
Plot 1
scores: not implemented
data source:amber_detector
(QC1 database)
dataset:bad_pixels*
average:none
fixed thresholds:0...300NONE
N_data plotted:13
[click on plot for closeup]
Plot 2
scores: not implemented
data source:amber_detector
(QC1 database)
dataset:bad_pixels_ratio*
average:none
fixed thresholds:0...0.11NONE
N_data plotted:13
[click on plot for closeup]
This plot

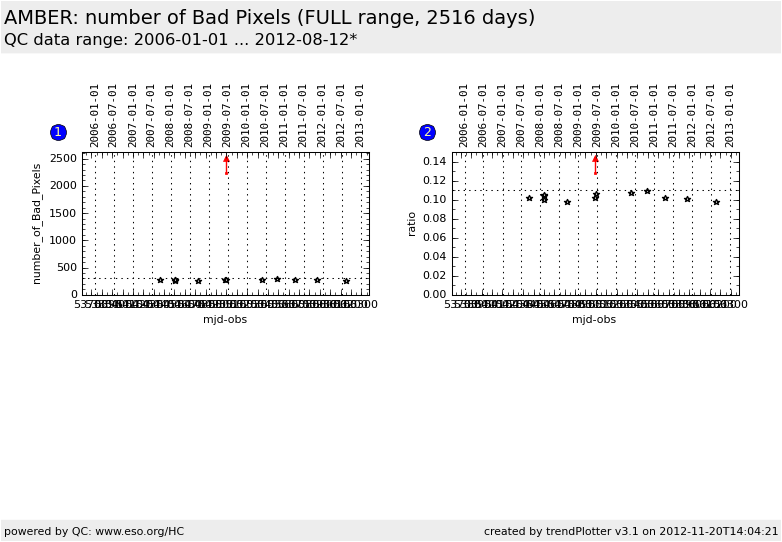
The number of Bad Pixels is monitored and is extracted from the calibration darks and Flat Field.
The AMBER detector is 512x512, the scale of the left plot is 3.5% of the detector These data are taken once a period in average.  


General information

Click on any of the plots to see a close-up version. The latest date is indicated on top of the plot, data points belonging to that date are specially marked.

If configured,

  • statistical averages are indicated by a solid line, and thresholds by broken lines
  • outliers are marked by a red asterisk. They are defined as data points outside the threshold lines
  • "aliens" (= data points outside the plot Y limits) are marked by a red arrow ( or )
  • you can download the data for each parameter set if the 'Data downloads' link shows up