|
|
| AMBER trending system: HISTORY report |
|
|
|
Last update: 2018-09-01T04:41:37 (UT)
|
|
|
|
|
*Date on this monitor changes at 21:00 UT |
|

|
| png: |
Information and research: |
|
- png file
|
- advanced studies:
QC1 browser |
QC1 plotter
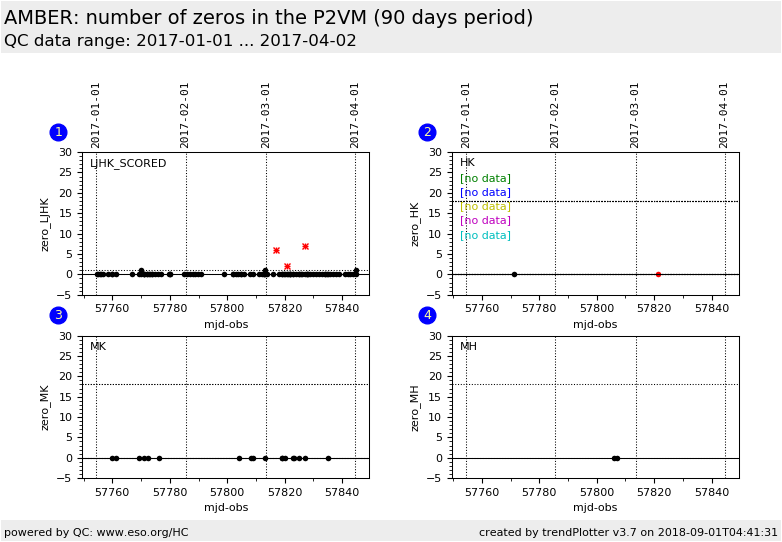
Some frames taken for the P2VM contains zeroes.
The data are useable except if the number of zeroes is too important, 1 file is 100 frames, there is either 1 or 99 frames with zeroes in a file when the proble occurs.
This is monitored until the problem is understood and definitively fixed
|
|
Plot
? |
Symb
? |
Source
* |
Average ? |
Thresholds ? |
N_
data |
QC1
parameter |
Data
downloads |
Remarks |
| method |
value |
unit |
method |
value |
| 1 |
• | QC1DB |
MEDIAN |
0 |
NONE |
VAL | 0,1 |
96 |
null_frames |
this |
last_yr |
all
|
SCORED: Low_JHK |
| 2 |
• | QC1DB |
MEDIAN |
0 |
NONE |
VAL | 0,18 |
1 |
null_frames |
this |
last_yr |
all
|
High_K_2.172 |
| 2 |
• | QC1DB |
MEDIAN |
0 |
NONE |
VAL | 0,18 |
1 |
null_frames |
this |
last_yr |
all
|
High_K_2.056 |
| 2 |
• | QC1DB |
MEDIAN |
|
NONE |
VAL | 0,18 |
0 |
null_frames |
this |
last_yr |
all
|
High_K_2.288 |
| 2 |
• | QC1DB |
MEDIAN |
|
NONE |
VAL | 0,18 |
0 |
null_frames |
this |
last_yr |
all
|
High_K_2.133 |
| 2 |
• | QC1DB |
MEDIAN |
|
NONE |
VAL | 0,18 |
0 |
null_frames |
this |
last_yr |
all
|
High_K_2.211 |
| 2 |
• | QC1DB |
MEDIAN |
|
NONE |
VAL | 0,18 |
0 |
null_frames |
this |
last_yr |
all
|
High_K_2.249 |
| 2 |
• | QC1DB |
MEDIAN |
|
NONE |
VAL | 0,18 |
0 |
null_frames |
this |
last_yr |
all
|
High_K_2.326 |
| 3 |
• | QC1DB |
MEDIAN |
0 |
NONE |
VAL | 0,18 |
11 |
null_frames |
this |
last_yr |
all
|
Medium_K_2.1 |
| 3 |
• | QC1DB |
MEDIAN |
0 |
NONE |
VAL | 0,18 |
7 |
null_frames |
this |
last_yr |
all
|
Medium_K_2.3 |
| 4 |
• | QC1DB |
MEDIAN |
0 |
NONE |
VAL | 0,18 |
2 |
null_frames |
this |
last_yr |
all
|
Medium_H_1_1.65 |
| |
|
*Data sources: QC1DB: QC1 database; LOCAL: local data source
|
| Plot 1 | | data source: | amber_p2vm
(QC1 database) |
| dataset: | null_frames | • |
| median: | 0 | NONE |
| fixed thresholds: | 0...1 | NONE |
| N_data plotted: | 96 |
| [click plot for closeup] |
| Plot 2 | | data source: | amber_p2vm
(QC1 database) |
dataset:
(numbers below apply to this dataset) | null_frames | • |
| median: | 0 | NONE |
| fixed thresholds: | 0...18 | NONE |
| N_data plotted: | 1 |
| [click plot for closeup] |
| Plot 3 | | data source: | amber_p2vm
(QC1 database) |
dataset:
(numbers below apply to this dataset) | null_frames | • |
| median: | 0 | NONE |
| fixed thresholds: | 0...18 | NONE |
| N_data plotted: | 11 |
| [click plot for closeup] |
| Plot 4 | | data source: | amber_p2vm
(QC1 database) |
| dataset: | null_frames | • |
| median: | 0 | NONE |
| fixed thresholds: | 0...18 | NONE |
| N_data plotted: | 2 |
| [click plot for closeup] |
Click on any of the plots to see a close-up version.
The latest date is indicated on top of the plot.
If configured,
- data points belonging to the latest date are specially marked
- statistical averages are indicated by a solid line, and thresholds by broken lines
- outliers are marked by a red asterisk. They are defined as data points outside the
threshold lines
- "aliens" (= data points outside the plot Y limits) are marked by a red arrow (↑ or ↓)
- you can download the data for each parameter set if the 'Data downloads' link shows up
|
|